你可以使用下面的工具来查看 Linux 或类 Unix 系统运行了多长时间:
- uptime : 告诉你服务器运行了多长的时间。
- lastt : 显示重启和关机时间。
- tuptime : 报告系统的运行时间历史和运行时间统计,这是指重启之间的运行时间。和 uptime 命令类似,不过输出结果更有意思。
找出系统上次重启时间和日期
你可以使用下面的命令来获取Linux操作系统的上次重启和关机时间及日期(在OSX/类Unix系统上也可以用):
### 显示系统重启和关机时间who -blast rebootlast shutdown### 开机信息uptimecat /proc/uptimeawk '{ print "up " $1 /60 " minutes"}' /proc/uptimew
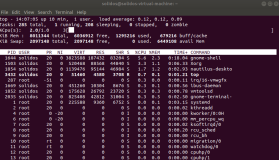
样例输出:

图01:用于找出服务器开机时间的多个Linux命令
跟 tuptime 问打个招呼吧
tuptime 命令行工具可以报告基于 Linux 的系统上的下列信息:
- 系统启动次数统计
- 注册首次启动时间(也就是安装时间)
- 正常关机和意外关机统计
- 平均开机时间和故障停机时间
- 当前开机时间
- 首次启动以来的开机和故障停机率
- 累积系统开机时间、故障停机时间和合计
- 报告每次启动、开机时间、关机和故障停机时间
安装
$ cd /tmp$ git clone https://github.com/rfrail3/tuptime.git$ ls$ cd tuptime$ ls
样例输出:

图02:克隆git仓库
确保你安装了带有 sys,optparse,os,re,string,sqlite3,datetime,disutils 和 locale 模块的 Python v2.7。
你可以像下面这样来安装:
$ sudo tuptime-install.sh
或者,可以手工安装(基于 systemd 或非 systemd ):
$ sudo cp /tmp/tuptime/latest/cron.d/tuptime /etc/cron.d/tuptime
如果系统是systemd的,拷贝服务文件并启用:
$ sudo cp /tmp/tuptime/latest/systemd/tuptime.service /lib/systemd/system/$ sudo systemctl enable tuptime.service
如果系统不是systemd的,拷贝初始化文件:
$ sudo cp /tmp/tuptime/latest/init.d/tuptime.init.d-debian7 /etc/init.d/tuptime$ sudo update-rc.d tuptime defaults
运行
只需输入以下命令:
$ sudo tuptime
样例输出:

图03:tuptime工作中
在一次更新内核后,我重启了系统,然后再次输入了同样的命令:
$ sudo tuptimeSystem startups: 2 since 03:52:16 PM 08/21/2015System shutdowns: 1 ok - 0 badAverage uptime: 7 days, 16 hours, 48 minutes and 3 secondsAverage downtime: 2 hours, 30 minutes and 5 secondsCurrent uptime: 5 minutes and 28 seconds since 06:23:06 AM 09/06/2015Uptime rate: 98.66 %Downtime rate: 1.34 %System uptime: 15 days, 9 hours, 36 minutes and 7 secondsSystem downtime: 5 hours, 0 minutes and 11 secondsSystem life: 15 days, 14 hours, 36 minutes and 18 seconds
你可以像下面这样修改日期和时间格式:
$ sudo tuptime -d '%H:%M:%S %m-%d-%Y'
样例输出:
System startups: 1 since 15:52:16 08-21-2015System shutdowns: 0 ok - 0 badAverage uptime: 15 days, 9 hours, 21 minutes and 19 secondsAverage downtime: 0 secondsCurrent uptime: 15 days, 9 hours, 21 minutes and 19 seconds since 15:52:16 08-21-2015Uptime rate: 100.0 %Downtime rate: 0.0 %System uptime: 15 days, 9 hours, 21 minutes and 19 secondsSystem downtime: 0 secondsSystem life: 15 days, 9 hours, 21 minutes and 19 seconds
计算每次启动、开机时间、关机和故障停机时间:
$ sudo tuptime -e
样例输出:
Startup: 1 at 03:52:16 PM 08/21/2015Uptime: 15 days, 9 hours, 22 minutes and 33 secondsSystem startups: 1 since 03:52:16 PM 08/21/2015System shutdowns: 0 ok - 0 badAverage uptime: 15 days, 9 hours, 22 minutes and 33 secondsAverage downtime: 0 secondsCurrent uptime: 15 days, 9 hours, 22 minutes and 33 seconds since 03:52:16 PM 08/21/2015Uptime rate: 100.0 %Downtime rate: 0.0 %System uptime: 15 days, 9 hours, 22 minutes and 33 secondsSystem downtime: 0 secondsSystem life: 15 days, 9 hours, 22 minutes and 33 seconds本文来自云栖社区合作伙伴“Linux中国”,原文发布日期:2015-09-28