PS: 这儿有不错的翻译:http://www.oschina.net/translate/using-top-more-efficiently
转: http://www.linuxforums.org/articles/using-top-more-efficiently_89.html
Among many monitoring tools that available, most people use "top" (a part of procps package). Top provide almost everything we need to monitor our system's resource usage within single shot. In this article, all the information are based on procps 3.2.5 running on top of Linux kernel 2.6.x
Here, we assume that procps package is already installed and run well in your Linux system. No previous experience with top is needed here, but if you had given it a try briefly, that would be an advantage.
Here are some challenges:
A. Interactive or batch mode?
By default, top is invoked using interactive mode. In this mode,top runs indefinitely and accepts keypress to redefine how top works.But, sometimes you need to post-process the top's output and this ishardly achieved using this mode. The solution? Use batch mode.
$ top -b
You will get output like below:
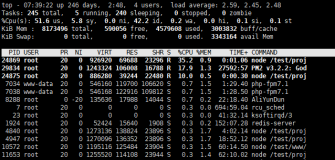
top - 15:22:45 up  4:19,  5 users,  load average: 0.00, 0.03, 0.00
Tasks:  60 total,   1 running,  59 sleeping,   0 stopped,   0 zombie
Cpu(s):  3.8% us,  2.9% sy,  0.0% ni, 89.6% id,  3.3% wa,  0.4% hi,  0.0% si
Mem:    515896k total,   495572k used,    20324k free,    13936k buffers
Swap:   909676k total,        4k used,   909672k free,   377608k cached
PID USER      PR  NI  VIRT  RES  SHR S %CPU %MEM    TIME+  COMMAND
  1 root      16   0  1544  476  404 S  0.0  0.1   0:01.35 init
  2 root      34  19     0    0    0 S  0.0  0.0   0:00.02 ksoftirqd/0
  3 root      10  -5     0    0    0 S  0.0  0.0   0:00.11 events/0
Uh, wait, it runs repeatedly, just like interactive mode does.Don't worry, limit its repetition with -n. So, if you just want single shot,type:
$ top -b -n 1
The real advantage of this mode is you can easily combine in withat or cron. Together, top can snapshot resource usage at certain timeunattendedly. For example, using at, we can schedule top to run 1 minutelater.
$ cat ./test.at
TERM=linux top -b -n 1 >/tmp/top-report.txt
$ at -f ./test.at now+1minutes
Careful reader might ask "why do I need to set TERM environment beforeinvoking top when creating new at job?". The answer is, top needs this variableset but unfortunately "at" isn't retained it from the time of invocation. Simplyset it like above and top will work smoothly.
B. How to monitor certain processes only?
Sometimes, we are only interested on several processes only,maybe just 4 or 5 of the whole existing processes. For example, if youwant monitor process identifier (PID) 4360 and 4358, you type:
$ top -p 4360,4358
OR
$ top -p 4360 -p 4358
Seems easy, just use -p and list all the PIDs you need, eachseparated with comma or simply use -p multiple times coupled with thetarget PID.
Another possibility is just monitoring process with certain useridentifier (UID). For this need, you can use -u or -U option. Assuminguser "johndoe" has UID 500, you can type:
$ top -u johndoe
OR
$ top -u 500
OR
$ top -U johndoe
The conclusion is, you can either use the plain user name or thenumeric UID. "-u, -U? Those two are different?" Yes. Like almost anyother GNU tools, options are case sensitive. -U means top will findmatching effective, real, saved and filesystem UIDs, while -u just find matchingeffective user id. Just for reminder, every *nix process runs usingeffective UID and sometimes it isn't equal with real user ID. Most likely,one is interested in effective UID as filesystem permission and operatingsystem capability are checked against it, not real UID.
While -p is just command-line option only, both -U and -u can beused inside interactive mode. Like you guess, press 'U' or 'u' to filterthe processes based on their user name. Same rule is applied, 'u' foreffective UID and 'U' for real/effective/saved/filesystem user name.You will be asked to enter the user name or the numeric UID.
{mospagebreak title=Fast or slow update?}C. Fast or slow update?
Before we answer this question, let's take a short look on howtop really works. Strace is your friend here:
$ strace -o /tmp/trace.txt top -b -n 1
Use you favourite text editor and load /tmp/trace.txt. What doyou think? A lot of jobs for single invocation, that is what I thinkand maybe you'll agree. One of the jobs top must do in every iterationis opening many files and parsing their contents, as shown by the number:
$ grep open( /tmp/hasil.txt | wc -l
Just for illustration, in my Linux system, it yields 304. Closerlook reveals that top iterates inside /proc directory to gather processesinformation. /proc itself is pseudo filesystem, meaning it doesn't existon real disk but is created on the fly by the Linux kernel and live on RAM.Within directory such as /proc/2097 (2097 is a PID), Linux kernel exportsinformation about related process and this is where top gathers processesinformation along with resource usage.
Also try these:
$ time top -b -n 1
This will give you illustration how fast top works on single round.In my system, this yields around 0.5-0.6 seconds. Look at "real" field,not the "user" or "system" field because "real" reflects the totaltime top needs to work.
So, realizing this fact, it will be wise to use moderate updateinterval. Browsing RAM based filesystem takes time too, so be wise.As rule of thumb, 1 to 3 seconds interval is enough for most users. Use -din command line option or press "s" inside interactive mode to set it.You can use fractional number as interval, e.g: 2.5, 4.1 and so on
When we should faster than 1 seconds?
| You need more samples during a time. For this need, better use batch modeand redirect standart output to a file so you can analyze it better. You don't mind with extra CPU load carried by top. Yes, it is small butit is still a load. If your Linux system is relatively idle, feel free touse short interval, but if not, better preserve your CPU time for moreimportant task. One way to reduce top's work is by monitoring certain PIDs only.This way, top won't need to traverse all the /proc sub-directory. How aboutuser name filtering? It won't do any good. User name filtering brings extrawork for top, thus combining it with very short interval will increase CPUload. Of course, whenever you need to force the update, just press Spaceand top will refresh the statistic right away. {mospagebreak title=Fields we need}D. Fields that we needBy default, top starts by showing the following task's property:
But, there are more. Here, I will just explain fields that mightinterest you:
To display the above fields, press 'f' inside the interactivemode. Then press the related key (mentioned above inside the parentheses).Those keys toggle the related fields, so press once to show it, press againto hide it. To find out whether the fields are displayed or not, simplywatch the series of letters on the first line (at the right of "CurrentFields"). Uppercase means the fields is shown, lower case means theopposite. Press Enter after you are satisfied with the selection. Sorting use similar way. Press 'O' (upper case) followed by akey representing the field. Don't worry if you don't remember the keymap, top will show it. The new sort key will be marked with asteriskand the letter will change to upper case, so you can notice it easily.Press Enter after you are finished {mospagebreak title=Multi view are better than one?}E. Multi view are better than one?In different situations, sometimes we want to monitor differentsystem property. For example, at one time you want to monitor %CPU andcpu time spent by all tasks. At another time, you want to monitorresident size and total page faults of all tasks. Rapidly press 'f' andchange the visible fields? I don't think this is a smart choice. Why don't you use Multiple Windows mode? Press 'A' (upper case)to switch to multi windows view. By default, you will see 4 differentset of field groups. Each field groups has a default label/name:
 1st field group is the usual group you see in single window view,while the rest are hidden. Inside multi window mode, press 'a' or 'w' tocycle through all the available windows. Pay attention, switching toanother window also change the active window (also known as current window).If you are not sure which one is currently the active one, just look atthe first line of top's display (at the left of current time field).Another way to change active window is by pressing 'G' followed bywindows number (1 to 4). Active window is the one which react to user input, so make sureto select your preferred window first before doing anything. After that,you can do anything exactly like you do in single window mode. Usually,what you want to do here is customizing field display, so just press 'f'and start customizing. If you think 4 is too much, just switch to a field group andpress '-' to hide it. Please note, even you hide current field group,that doesn't mean you also change the active group. Press '-' onceagain to make current group visible. If you are done with multi window mode, press 'A' again. Thatalso make active group as the new field group of single window mode. F. "How come there is only so few free memory on my Linux PC?"Come to same question? No matter how much you put RAM in yourmotherboard, you quickly notice the free RAM is reduced so fast. FreeRAM miscalculation? No! Before answering this, first check the memory summary located onthe upper side of top's display (you may need to press 'm' to unhide it).There, you will find two fields: buffers and cached. "Buffers" representhow much portion of RAM is dedicated to cache disk block. "Cached" is similarlike "Buffers", only this time it caches pages from file reading. Forthorough understanding of those terms, refer to Linux kernel book likeLinux Kernel Development by Robert M. Love. It is enough to understand that both "buffers" and "Cached" repre-sent the size of system cache. They dynamically grow or shrink as requestedby internal Linux kernel mechanism. Besides consumed by cache, the RAM itself is also occupied byapplication data and code. So, to conclude, free RAM size here meansRAM area that isn't occupied by cache nor application data/code. Generally,you can consider cache area as another "free" RAM since it will be shrunkgradually if the application demands more memory. On the task point of view, you might wonder which field trulyrepresent memory consumption. VIRT field? certainly not! Recall thatthis field represent everything inside task address space, includingthe related shared libraries. After reading top source code and proc.txt(inside Documentation/filesystem folder of kernel source's tree),I conclude that RSS field is the best field describing task's memoryconsumption. I said "best" because you should consider it as approximationand isn't 100% accurate on all time. G. Working with many saved configurationsWanna keep several different configuration of top so you can easilyswitch between preconfigured display? Just create symbolic link tothe top binary (name it anything you like: # ln -s /usr/bin/top /usr/bin/top-a Then run the new "top-a". Do the tweak and press 'W' to save theconfiguration. It will be saved under ~/.top-arc (the format is yourtop alias name+'rc'). Now run the original top to load your first display alternative, top-afor the second one and so on. {mospagebreak title=Conclusion}H. ConclusionThere are numerous tricks to use top more efficiently. The keyis by knowing what you really need and possibly a little good understandingof Linux low level mechanism. The statistics isn't always correct, but at leastit is helpful as a overall measurement. All these numbers are gathered from/proc, so make sure it is mounted first! Reference:
|