(未完待续)


Open Telemetry模块分解
- Collectors can communicate with various backends via exporters
- Configuration controls aggregation, batching, and processing
- In-proc exporters are easily replaceable to work with different backend
- SDK allows various extensions: sampling, filtering, enrichments
- OpenTelemetry SDK package can be completely replaced

最佳实践
Tracer:
- Customer Attributes: Add custom properties for easier querying and differentiating telemetry.
-
Resource API: define resource attributes, which are distinct from regular attributes
- Deployment name and location
- App name and version
- Hosting environment
-
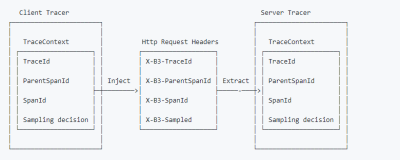
Propagation:
- use it as a metrics dimension or
- attribute spans
OT视角的一种实现
jobsQueuedGauge := meter.NewFloat64Gauge("jobs_queued", metric.WithDescription("The number of jobs currently queued"))

err := tracer.WithSpan(ctx, "jobEnqueue", func(ctx context.Context) error { jobsTotal, err := jobQueue.Enqueue(job) if err != nil { return err } jobsQueuedGauge.Set(ctx, jobsTotal)

})

基于M3DB的一种实现
# HELP http_requests_total http_requests # TYPE http_requests_total counter http_requests_total{endpoint="/search",status_code="2xx"} 1725 # {trace_id="b096e71d..."} http_requests_total{endpoint="/search",status_code="4xx"} 4 # {trace_id=" 944a6d97..."} http_requests_total{endpoint="/search",status_code="5xx"} 27 # {trace_id="50785260..."} http_request_latency_bucket{endpoint="/search",le="0.1"} 7 # {trace_id=" 7f78deda..."}
支持采样机制

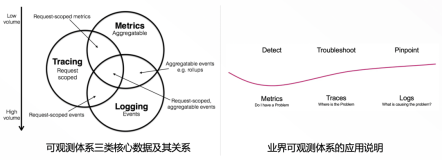
统一模型
Trace有Metric关系

数据表示上可以用Time + KeyValue方式融合

Metric与Trace、Log关联原理
- 同一个时间段
- 同一个实体Entity:例如通过Namespace,Location,Label等关联
- (*)同一个TraceId

一种融合的观点
(待添加)
Reference
- OpenTelemetry The First Release, What’s Next, and How to Get Involved - Morgan McLean, Google; Tristan Sloughter, Postmates; Sergey Kanzhelev, Microsoft; & Chris Kleinknecht, Google
- Beyond Getting Started Using OpenTelemetry to Its Full Potential - Sergey Kanzhelev, Microsoft & Morgan McLean