一.简述
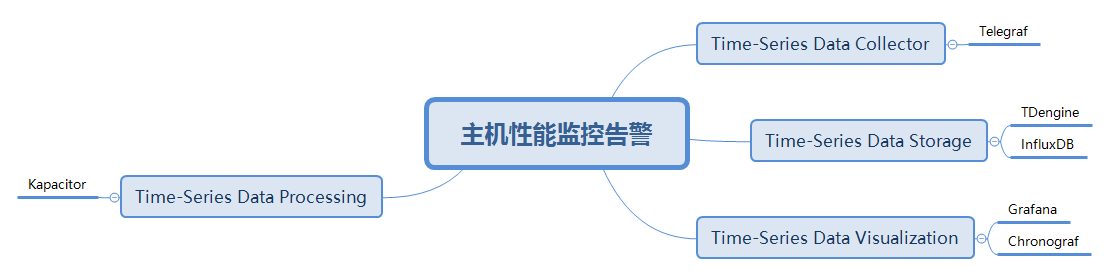
通过TICK(Telegraf+Influxdb+Chronograf+Kapacitor)进行主机性能监控告警,职责描述如下:
- Telegraf的职能是数据采集,用于主机性能数据,包括主机CPU、内存、IO、进程状态、服务状态等
- Influxdb的职能是时序数据库,用于存储Telegraf采集来的数据
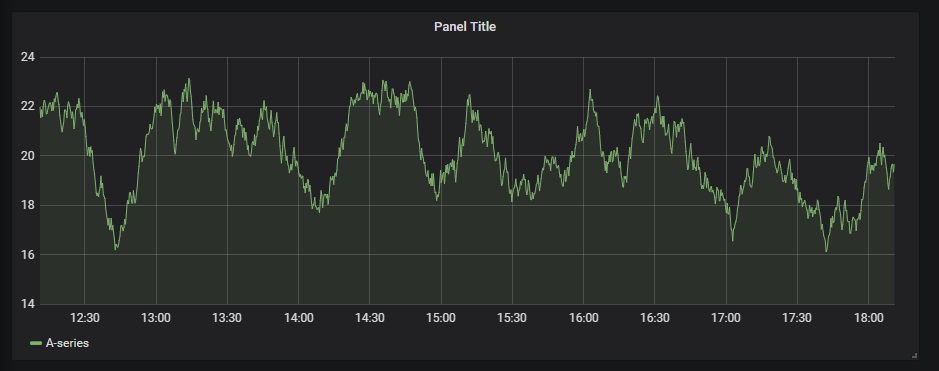
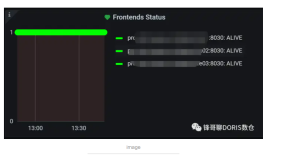
- Chronograf的职能是数据可视化,用于将Influxdb数据库的性能数据时序展示
- Kapacitor的职能是规则告警,用于配置告警规则将Influxdb数据库查询触发规则的数据进行告警
其中,时序数据库可使用刚开源的TDEngine,可视化可以使用Grafana替代使用
组合职能
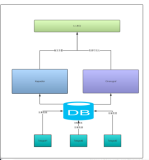
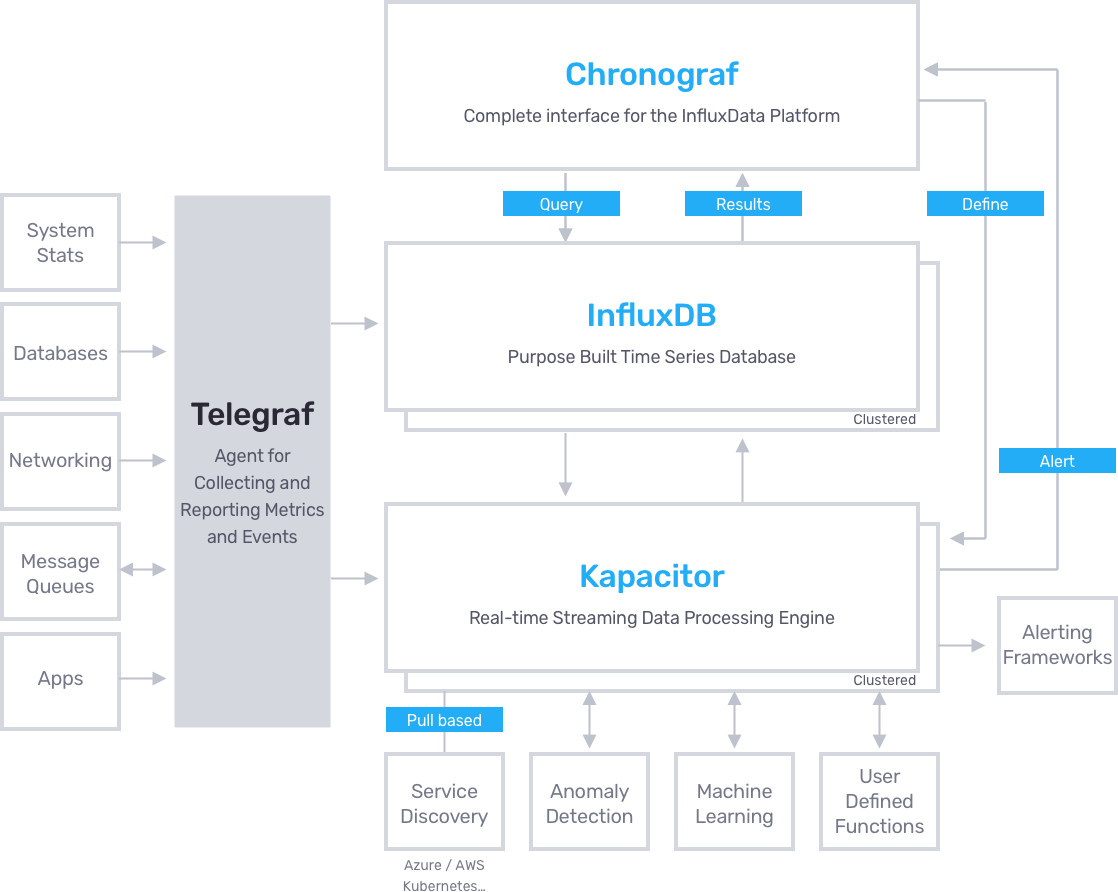
组合架构
二.安装试用
所有组件将以Windows版做测试试用
Ⅰ).TICK下载
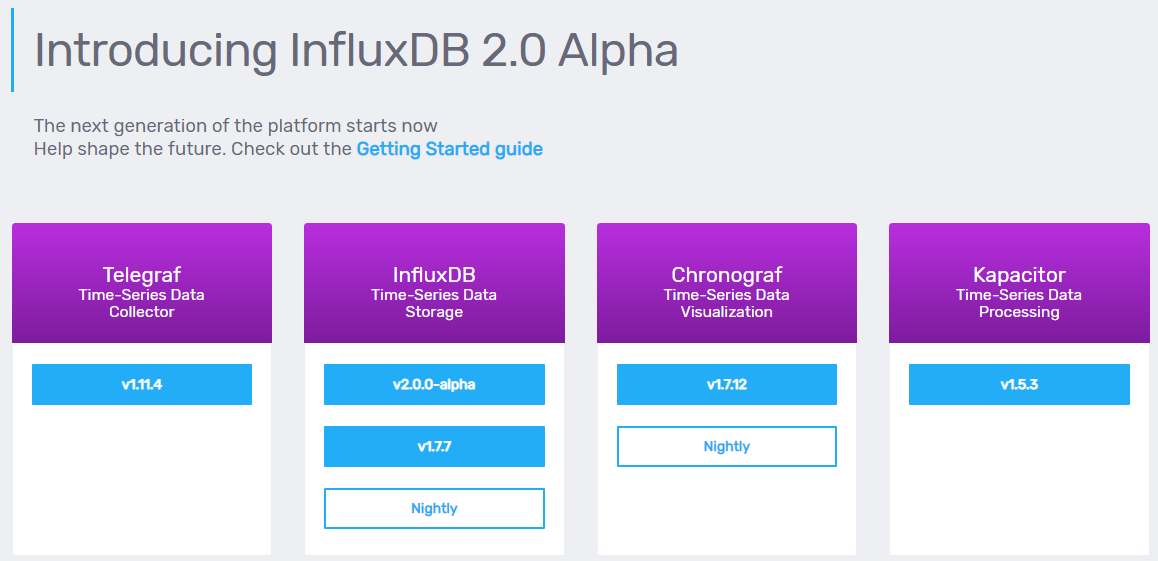
下载地址
| Telegraf | Influxdb | Chronograf | Kapacitor | |
|---|---|---|---|---|
| Linux版 | telegraf-1.11.4 | infuxdb-1.7.7 | chronograf-1.7.12 | telegraf-1.11.4 |
| Windows版 | telegraf-1.11.4 | infuxdb-1.7.7 | chronograf-1.7.12 | telegraf-1.11.4 |
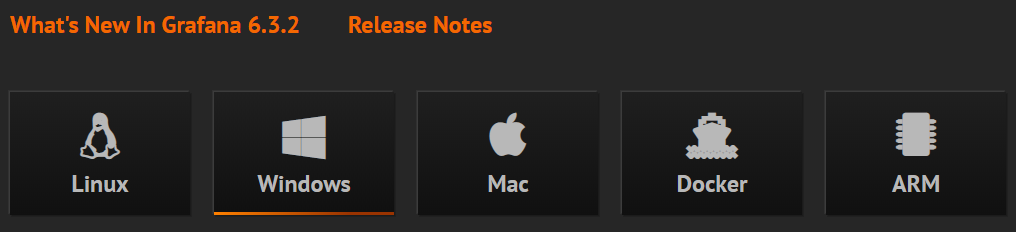
Grafana下载地址
Ⅱ).TICK安装
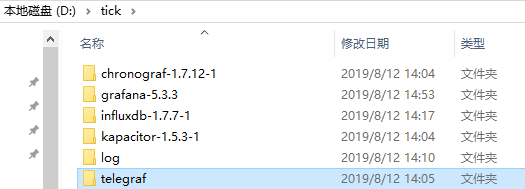
1).解压
2).配置
a).telegraf.conf
 ## Logging configuration:
  ## Run telegraf with debug log messages.
  debug = false
  ## Run telegraf in quiet mode (error log messages only).
  quiet = false
  ## Specify the log file name. The empty string means to log to stderr.
  logfile = "D:/tick/log/telegraf.log"
b).influxdb.conf
[meta]
  # Where the metadata/raft database is stored
  # dir = "/var/lib/influxdb/meta"
  dir = "D:/tick/influxdb-1.7.7-1/meta"

[data]
  # The directory where the TSM storage engine stores TSM files.
  # dir = "/var/lib/influxdb/data"
  dir = "D:/tick/influxdb-1.7.7-1/data"

  # The directory where the TSM storage engine stores WAL files.
  #wal-dir = "/var/lib/influxdb/wal"
  wal-dir = "D:/tick/influxdb-1.7.7-1/wal"

[logging]
  # Determines which log encoder to use for logs. Available options
  # are auto, logfmt, and json. auto will use a more a more user-friendly
  # output format if the output terminal is a TTY, but the format is not as
  # easily machine-readable. When the output is a non-TTY, auto will use
  # logfmt.
  # format = "auto"
  format = "auto"

  # Determines which level of logs will be emitted. The available levels
  # are error, warn, info, and debug. Logs that are equal to or above the
  # specified level will be emitted.
  # level = "info"
  level = "info"
c).kapacitor.conf
data_dir =  "D:/tick/kapacitor-1.5.3-1"

[logging]
    # Destination for logs
    # Can be a path to a file or 'STDOUT', 'STDERR'.
    # file = "/var/log/kapacitor/kapacitor.log"
    file = "D:/tick/kapacitor-1.5.3-1/kapacitor.log"

    # Logging level can be one of:
    # DEBUG, INFO, ERROR
    # HTTP logging can be disabled in the [http] config section.
    level = "INFO"

[load]
  # Enable/Disable the service for loading tasks/templates/handlers
  # from a directory
  enabled = true
  # Directory where task/template/handler files are set
  # dir = "/etc/kapacitor/load"
  dir = "D:/tick/kapacitor-1.5.3-1/load"


[replay]
  # Where to store replay files, aka recordings.
  # dir = "/var/lib/kapacitor/replay"
  dir = "D:/tick/kapacitor-1.5.3-1/replay"

[task]
  # Where to store the tasks database
  # DEPRECATED: This option is not needed for new installations.
  # It is only used to determine the location of the task.db file
  # for migrating to the new `storage` service.
  # dir = "/var/lib/kapacitor/tasks"
  dir = "D:/tick/kapacitor-1.5.3-1/tasks"

  # How often to snapshot running task state.
  snapshot-interval = "60s"

[storage]
  # Where to store the Kapacitor boltdb database
  # boltdb = "/var/lib/kapacitor/kapacitor.db"
  boltdb = "D:/tick/kapacitor-1.5.3-1/kapacitor.db"
d).custom.ini
[paths]
# Path to where grafana can store temp files, sessions, and the sqlite3 db (if that is used)
# ;data = /var/lib/grafana
;data = D:/tick/grafana-6.3.2

# Temporary files in `data` directory older than given duration will be removed
;temp_data_lifetime = 24h

# Directory where grafana can store logs
# ;logs = /var/log/grafana
;logs = D:/tick/grafana-6.3.2/log

# Directory where grafana will automatically scan and look for plugins
# ;plugins = /var/lib/grafana/plugins
;plugins = D:/tick/grafana-6.3.2/plugins

# folder that contains provisioning config files that grafana will apply on startup and while running.
;provisioning = conf/provisioning

[server]
# Protocol (http, https, socket)
;protocol = http

# The ip address to bind to, empty will bind to all interfaces
;http_addr =

# The http port  to use
# ;http_port = 3000
;http_port = 8080
3).启动
a).Telegraf
telegraf.exe -sample-config -input-filter cpu:mem -output-filter influxdb > telegraf_2.conf

telegraf --config telegraf_2.conf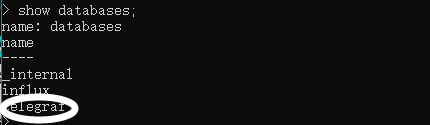
b).Influxdb
influxd.exec).Chronograf
chronograf.exed).Kapacitor
kapacitord.exe
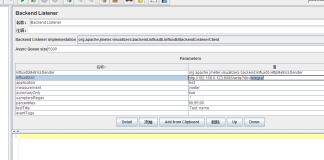
kapacitor.exe define task_test -tick kapacitord_test.tick -dbrp "monitor_db.autogen" -type "stream"
e).Grafana
grafana-server.exe4).验证
a).Influxdb
influx.exe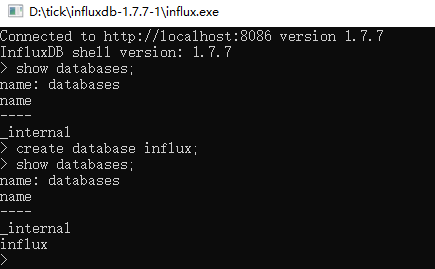
b).Chronograf
URL: http://localhost:8888
Username: admin
Password: admin
登陆
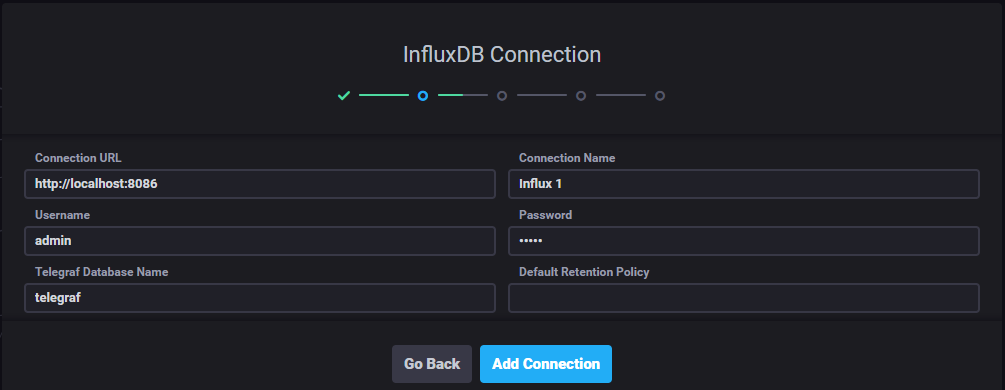
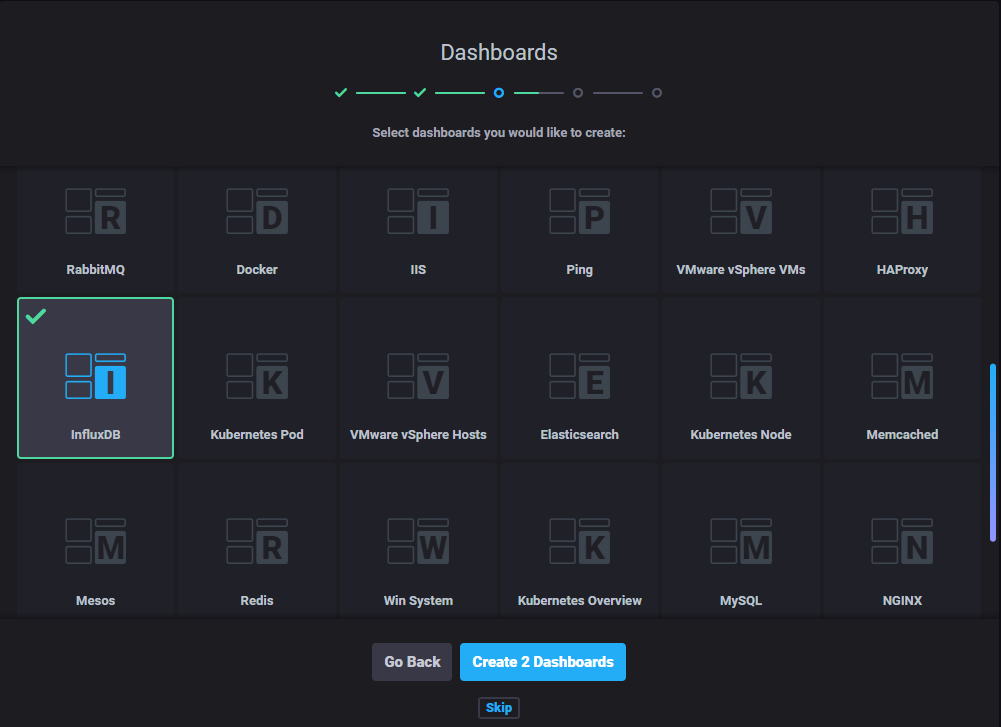
选择Dashboards
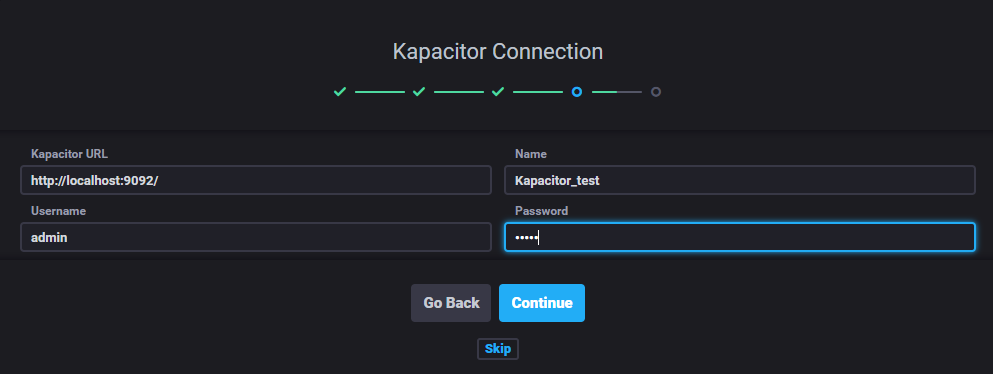
连接Kapacitor
c).Grafana
URL: http://localhost:3000
Username: admin
Password: admin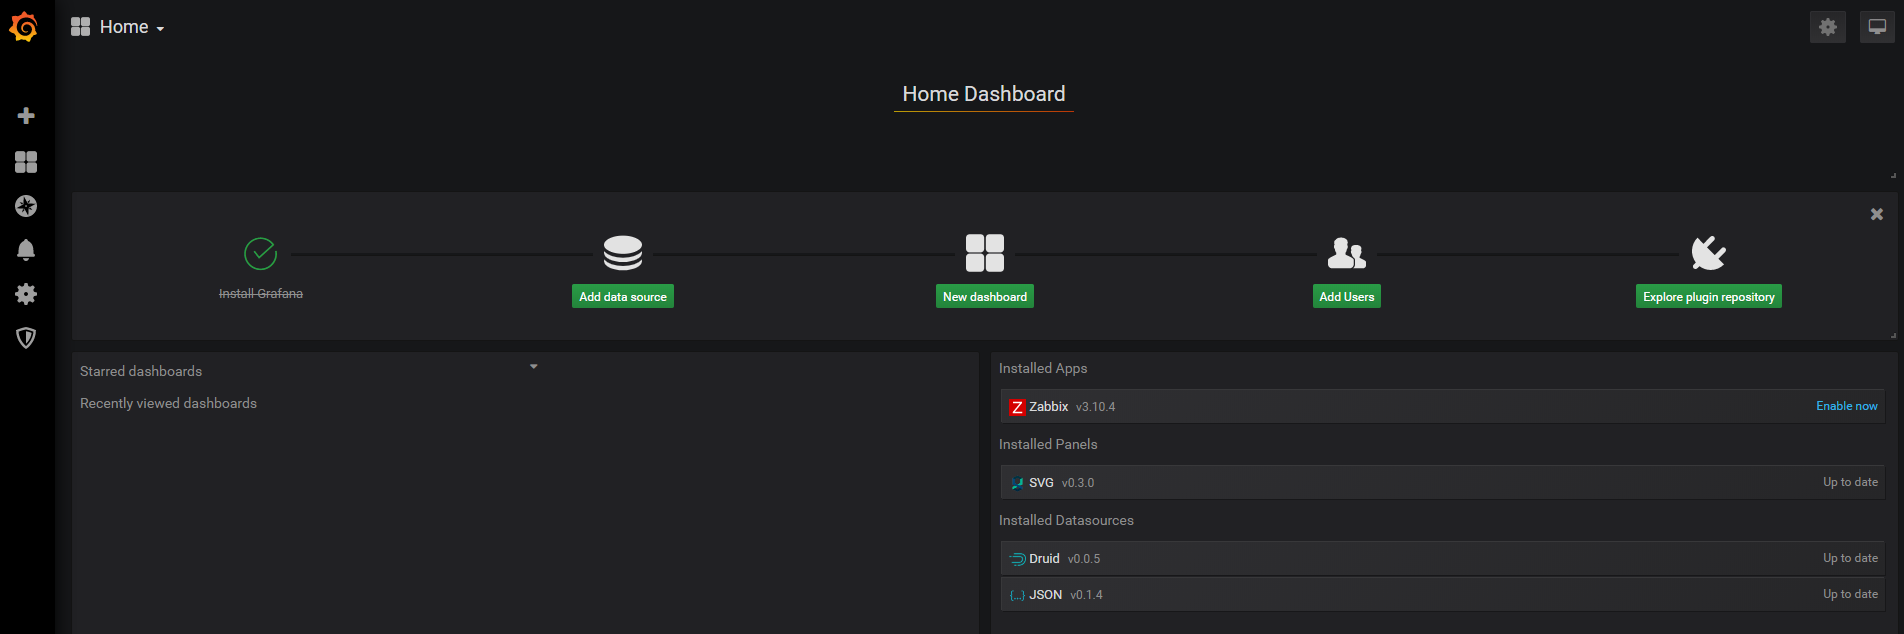
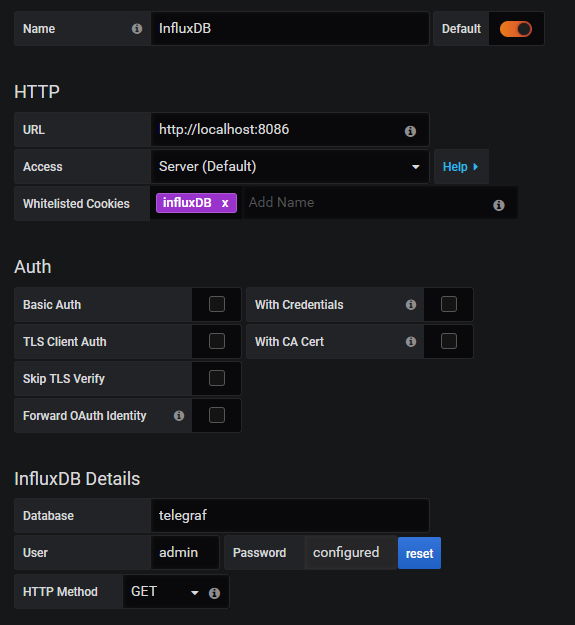
配置数据源
Ⅲ).监控数据
Chronograf
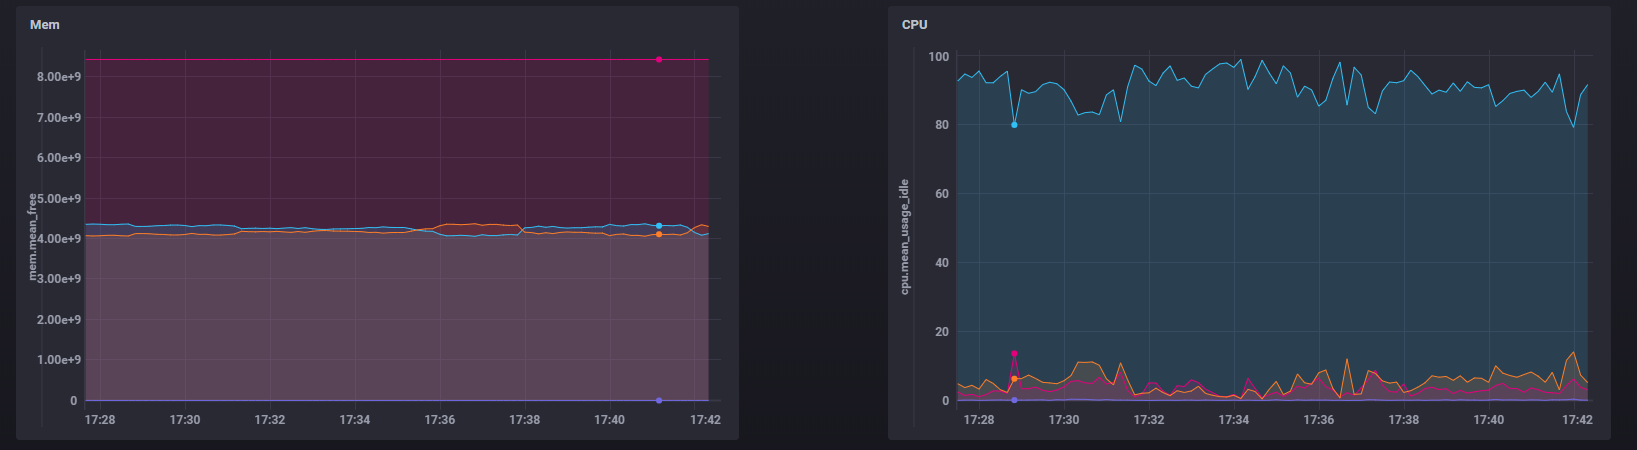
Grafana