spark for python developer 一书,说实在的,质量一般,但勉强可以作为python 工程师的入门资料,至此,这一时段的地铁译结束了,开始新的阅读旅程……
对于 Python 的图形绘制和可视化, 有大量的工具和库,和我们最相关并且有趣的是:
• Matplotlib 是Python 绘图库的鼻祖. Matplotlib 最初7由 John Hunter 创作, 他是开源软件的支持者,建立的 Matplotlib 是学术界和数据科学界最流行的绘图库之一。 Matplotlib 支持生成线图,直方图,功率谱,饼图,误差图,散点图等等。 从 Matplotlib 网站可以看到大量的例子 http://matplotlib.org/examples/index.html.
• Seaborn, 由 Michael Waskom 开发, 是一个快速可视化统计信息的很棒的库,构建在Matplotlib 之上,无缝集成了 Pandas 和 Python 的数据栈, 包括Numpy. Seaborn 图库 在 http://stanford.edu/~mwaskom/ software/seaborn/examples/index.html 展示了这个库的潜力。
• ggplot 是一个新的库,目标是提供R 生态系统中著名的ggplot2 的等价物,是一本Python 的数据封装。它有着和 ggplot2 相同的外观和感觉,使用了由Hadley Wickham 做详细说明的图语法,,由yhat 团队完成了Python 移植。更多信息参考 http://ggplot.
yhathq.com.
• Bokeh 使用了大量的D3.js 的概念,目标是在大数据集或流式数据集上提供高性能的可交互性,而不需要写一些令人恐惧的 javascript and css 代码. Bokeh 在浏览器上交付了动态可视化,有没有服务器都可以。它无缝集成了 Matplotlib, Seaborn and ggplot ,可以在 IPython notebooks 或者 Jupyter notebooks 中漂亮地渲染. Bokeh 由 Continuum.io 的一个团队开发, 是Anaconda Python数据栈中有机的一部分。
Bokeh server 提供一个成熟的动态绘图引擎,从JSON中实现了反应式场景图。它使用web sockets 保持状态, 通过Backbone.js 和Coffee-script 更新 HTML5 canvas。 Bokeh, 由于从JSON中读取数据, 能容易地绑定例如 R, Scala, and Julia 这样的其他语言。这里给出了 主要的绘图和可视化库的概览,是不详尽的。让我们集中在可视化的例子上面。
数据可视化的预处理
在进入可视化之前,要在所采集的数据上做些准备工作:
In  [16]:
#  Read  harvested  data  stored  in  csv  in  a  Panda  DF
import  pandas  as  pd
csv_in  =  '/home/an/spark/spark-1.5.0-bin-hadoop2.6/examples/AN_Spark/
data/unq_tweetstxt.csv'
pddf_in  =  pd.read_csv(csv_in,  index_col=None,  header=0,  sep=';',
encoding='utf-8')
In  [20]:
print('tweets  pandas  dataframe  -  count:',  pddf_in.count())
print('tweets  pandas  dataframe  -  shape:',  pddf_in.shape)
print('tweets  pandas  dataframe  -  colns:',  pddf_in.columns)
('tweets  pandas  dataframe  -  count:',  Unnamed:  0   7540
id  7540
created_at  7540
user_id 7540
user_name   7538
tweet_text  7540
dtype:  int64)
('tweets  pandas  dataframe  -  shape:',  (7540,  6))
('tweets  pandas  dataframe  -  colns:',  Index([u'Unnamed:  0',
u'id',  u'created_at',  u'user_id',  u'user_name',  u'tweet_text'],
dtype='object'))
为了可视化活动, 使用了一个7,540 tweets的数据集。 关键信息存储在 tweet_text 字段. 先调用head()函数来预览一下存储在dataframe 中的数据:
In  [21]:
pddf_in.head()
Out[21]:
Unnamed:  0 id  created_at  user_id user_name   tweet_text
0   0   638830426971181057  Tue  Sep  01  21:46:57  +0000  2015
3276255125  True  Equality  ernestsgantt:  BeyHiveInFrance:  9_A_6:
dreamint...
1   1   638830426727911424  Tue  Sep  01  21:46:57  +0000  2015
3276255125  True  Equality  ernestsgantt:  BeyHiveInFrance:
PhuketDailyNews...
2   2   638830425402556417  Tue  Sep  01  21:46:56  +0000  2015
3276255125  True  Equality  ernestsgantt:  BeyHiveInFrance:  9_A_6:
ernestsg...
3   3   638830424563716097  Tue  Sep  01  21:46:56  +0000  2015
3276255125  True  Equality  ernestsgantt:  BeyHiveInFrance:
PhuketDailyNews...
4   4   638830422256816132  Tue  Sep  01  21:46:56  +0000  2015
3276255125  True  Equality  ernestsgantt:  elsahel12:  9_A_6:
dreamintention...
现在创建一下工具函数来清空 tweet 文本并解析twitter 的日期 。首先,导入 Python 正则表达式库 re 和时间库:
 In  [72]:
import  re
import  time
创建一个 regex 字典,将被编译,然后昨晚函数传递:
• RT: 第一个以RT作为主键的 regex 在tweet 文本中寻找以 RT 开头的关键字 :
re.compile(r'^RT'),
• ALNUM: 第二个以ALNUM 为主键的regex 在tweet文本中寻找包含字母和下划线的@:
re.compile(r'(@[a-zA-Z0-9_]+)'),
• HASHTAG: 第三个 以HASHTAG 为主键的 regex 在tweet 文本中寻找#符号中的字符:
re.compile(r'(#[\w\d]+)'),
• SPACES: 第四个以SPACES 为主键的 regex 寻找tweet 文本中的空格或分行符 :
re.compile(r'\s+'),
• URL: 第5个以URL 为主键的 regex 寻找tweet 文本中以https:// or http:// 开头的字符 :
re.compile(r'([https://|http://]?[a-zA-Z\d\/]+[\.]+[a-zA-
Z\d\/\.]+)')

In  [24]:


regexp  =  {"RT":  "^RT",  "ALNUM":  r"(@[a-zA-Z0-9_]+)",
"HASHTAG":  r"(#[\w\d]+)",  "URL":
r"([https://|http://]?[a-zA-Z\d\/]+[\.]+[a-zA-Z\d\/\.]+)","SPACES":r"\s+"}
regexp  =  dict((key,  re.compile(value))  for  key,  value  in  regexp.items())

In  [25]:
regexp
Out[25]:
{'ALNUM':  re.compile(r'(@[a-zA-Z0-9_]+)'),
'HASHTAG':  re.compile(r'(#[\w\d]+)'),
'RT':  re.compile(r'^RT'),
'SPACES':  re.compile(r'\s+'),
'URL':  re.compile(r'([https://|http://]?[a-zA-Z\d\/]+[\.]+[a-zA-
Z\d\/\.]+)')}
创建一些工具函数:
In  [77]:
def  getAttributeRT(tweet):
    """  see  if  tweet  is  a  RT  """
    return  re.search(regexp["RT"],  tweet.strip())  !=  None
然后,提取一个tweet中的用户句柄:
def  getUserHandles(tweet):
    """  given  a  tweet  we  try  and  extract  all  user  handles"""
    return  re.findall(regexp["ALNUM"],  tweet)
从一个tweet 中提取所有 hashtags :
def  getHashtags(tweet):
    """  return  all  hashtags"""
    return  re.findall(regexp["HASHTAG"],  tweet)
提取所有的URL 链接:
def  getURLs(tweet):
    """  URL  :  [http://]?[\w\.?/]+"""
    return  re.findall(regexp["URL"],  tweet)
处理tweet 文本中的@符号,这个函数是 接下来wordcloud 的基础 :
def  getTextNoURLsUsers(tweet):
    """  return  parsed  text  terms  stripped  of  URLs  and  User  Names  in tweet  text
    '  '.join(re.sub("(@[A-Za-z0-9]+)|([^0-9A-Za-z  \t])|(\w+:\/\/\
    S+)","  ",x).split())  """
    return  '  '.join(re.sub("(@[A-Za-z0-9]+)|([^0-9A-Za-z  \t])|(\
    w+:\/\/\S+)|(RT)","  ",  tweet).lower().split())
标注数据后,创建数据集wordcloud分组:
def  setTag(tweet):
    """  set  tags  to  tweet_text  based  on  search  terms  from  tags_list"""
    tags_list  =  ['spark',  'python',  'clinton',  'trump',  'gaga',
    'bieber']
    lower_text  =  tweet.lower()
    return  filter(lambda  x:x.lower()  in  lower_text,tags_list)
解析日期成 yyyy-mm-dd hh:mm:ss 格式:
def  decode_date(s):
    """  parse  Twitter  date  into  format  yyyy-mm-dd  hh:mm:ss"""
    return  time.strftime('%Y-%m-%d  %H:%M:%S',  time.strptime(s,'%a  %b
    %d  %H:%M:%S  +0000  %Y'))
处理前预览数据:
In  [43]:
pddf_in.columns
Out[43]:
Index([u'Unnamed:  0',  u'id',  u'created_at',  u'user_id',  u'user_name',
u'tweet_text'],  dtype='object')
In  [45]:
#  df.drop([Column  Name  or  list],inplace=True,axis=1)
pddf_in.drop(['Unnamed:  0'],  inplace=True,  axis=1)
In  [46]:
pddf_in.head()
Out[46]:
id  created_at  user_id user_name   tweet_text
0   638830426971181057  Tue  Sep  01  21:46:57  +0000  2015 3276255125
True  Equality  ernestsgantt:  BeyHiveInFrance:  9_A_6:  dreamint...
1   638830426727911424  Tue  Sep  01  21:46:57  +0000  2015 3276255125
True  Equality  ernestsgantt:  BeyHiveInFrance:  PhuketDailyNews...
2   638830425402556417  Tue  Sep  01  21:46:56  +0000  2015 3276255125
True  Equality  ernestsgantt:  BeyHiveInFrance:  9_A_6:  ernestsg...
3   638830424563716097  Tue  Sep  01  21:46:56  +0000  2015 3276255125
True  Equality  ernestsgantt:  BeyHiveInFrance:  PhuketDailyNews...
4   638830422256816132  Tue  Sep  01  21:46:56  +0000  2015 3276255125
True  Equality  ernestsgantt:  elsahel12:  9_A_6:  dreamintention...
创建了新的dataframe,给每个字段建一个新的列 htag, user handles, URLs,
URLs提取出的文字, 不想用的字符和标签 。 最后,对日期解析:
In  [82]:
pddf_in['htag']  =  pddf_in.tweet_text.apply(getHashtags)
pddf_in['user_handles']  =  pddf_in.tweet_text.apply(getUserHandles)
pddf_in['urls']  =  pddf_in.tweet_text.apply(getURLs)
pddf_in['txt_terms']  =  pddf_in.tweet_text.apply(getTextNoURLsUsers)
pddf_in['search_grp']  =  pddf_in.tweet_text.apply(setTag)
pddf_in['date']  =  pddf_in.created_at.apply(decode_date)
下面的代码给出了新创建dataframe的截图:
In  [83]:
pddf_in[2200:2210]
Out[83]:
id  created_at  user_id user_name   tweet_text  htag    urls
ptxt    tgrp    date    user_handles    txt_terms   search_grp
2200    638242693374681088  Mon  Aug  31  06:51:30  +0000  2015 19525954
CENATIC El  impacto  de  @ApacheSpark  en  el  procesamiento...
[#sparkSpecial] [://t.co/4PQmJNuEJB]    el  impacto  de  en  el
procesamiento  de  datos  y  e...   [spark] 2015-08-31  06:51:30    [@
ApacheSpark]    el  impacto  de  en  el  procesamiento  de  datos  y  e...
[spark]
2201    638238014695575552  Mon  Aug  31  06:32:55  +0000  2015 51115854
Nawfal  Real  Time  Streaming  with  Apache  Spark\nhttp://...  [#IoT,
#SmartMelboune,  #BigData,  #Apachespark]   [://t.co/GW5PaqwVab]    real
time  streaming  with  apache  spark  iot  smar...  [spark] 2015-08-
31  06:32:55    []  real  time  streaming  with  apache  spark  iot  smar...
[spark]
2202    638236084124516352  Mon  Aug  31  06:25:14  +0000  2015 62885987
Mithun  Katti   RT  @differentsachin:  Spark  the  flame  of  digita...
[#IBMHackathon,  #SparkHackathon,  #ISLconnectIN... []  spark
the  flame  of  digital  india  ibmhackathon  ...   [spark]2015-08-
31  06:25:14    [@differentsachin,  @ApacheSpark]   spark  the  flame  of
digital  india  ibmhackathon  ...   [spark]
2203    638234734649176064  Mon  Aug  31  06:19:53  +0000  2015 140462395
solaimurugan  v Installing  @ApacheMahout  with  @ApacheSpark  1.4...
[]  [1.4.1,  ://t.co/3c5dGbfaZe.]   installing  with  1  4  1  got  many
more  issue  whil...    [spark] 2015-08-31  06:19:53    [@ApacheMahout,
@ApacheSpark]   installing  with  1  4  1  got  many  more  issue  whil...
[spark]
2204    638233517307072512  Mon  Aug  31  06:15:02  +0000  2015
2428473836  Ralf  Heineke   RT  @RomeoKienzler:  Join  me  @velocityconf
on  #m...   [#machinelearning,  #devOps,  #Bl]  [://t.co/U5xL7pYEmF]
join  me  on  machinelearning  based  devops  operat... [spark] 2015-08-
31  06:15:02    [@RomeoKienzler,  @velocityconf,  @ApacheSpark] join  me
on  machinelearning  based  devops  operat...   [spark]
2205    638230184848687106  Mon  Aug  31  06:01:48  +0000  2015 289355748
Akim  Boyko RT  @databricks:  Watch  live  today  at  10am  PT  is...
[]  [1.5,  ://t.co/16cix6ASti]  watch  live  today  at  10am  pt  is  1
5  presented  b...  [spark] 2015-08-31  06:01:48    [@databricks,  @
ApacheSpark,  @databricks,  @pwen...    watch  live  today  at  10am  pt  is  1
5  presented  b...  [spark]
2206    638227830443110400  Mon  Aug  31  05:52:27  +0000  2015 145001241
sachin  aggarwal    Spark  the  flame  of  digital  India  @  #IBMHackath...
[#IBMHackathon,  #SparkHackathon,  #ISLconnectIN... [://t.co/
C1AO3uNexe] spark  the  flame  of  digital  india  ibmhackathon  ...
[spark] 2015-08-31  05:52:27    [@ApacheSpark]  spark  the  flame  of
digital  india  ibmhackathon  ...   [spark]
2207    638227031268810752  Mon  Aug  31  05:49:16  +0000  2015 145001241
sachin  aggarwal    RT  @pravin_gadakh:  Imagine,  innovate  and  Igni...
[#IBMHackathon,  #ISLconnectIN2015] []  gadakh  imagine  innovate
and  ignite  digital  ind...    [spark] 2015-08-31  05:49:16    [@pravin_gadakh,  @ApacheSpark] gadakh  imagine  innovate  and  ignite  digital ind...  [spark]
2208    638224591920336896  Mon  Aug  31  05:39:35  +0000  2015 494725634 IBM  Asia  Pacific    RT  @sachinparmar:  Passionate  about  Spark??  Hav...
[#IBMHackathon,  #ISLconnectIN] [India..]   passionate  about  spark have  dreams  of  clean  sa... [spark] 2015-08-31  05:39:35    [@sachinparmar] passionate  about  spark  have  dreams  of  clean  sa...
[spark]
2209    638223327467692032  Mon  Aug  31  05:34:33  +0000  2015
3158070968  Open  Source  India "Game  Changer"  #ApacheSpark  speeds  up
#bigdata... [#ApacheSpark,  #bigdata]   [://t.co/ieTQ9ocMim]    game changer  apachespark  speeds  up  bigdata  pro...  [spark] 2015-08-31  05:34:33    []  game  changer  apachespark  speeds  up  bigdata  pro...
[spark]
把 处理过的信息保存为 CSV 格式.,有7,540 记录和 13个字段. 根据选择的数据集输出:
In  [84]:
f_name  =  '/home/an/spark/spark-1.5.0-bin-hadoop2.6/examples/AN_Spark/
data/unq_tweets_processed.csv'
pddf_in.to_csv(f_name,  sep=';',  encoding='utf-8',  index=False)
In  [85]:
pddf_in.shape
Out[85]:
(7540,  13)
看一眼words, moods, 和memes 划分
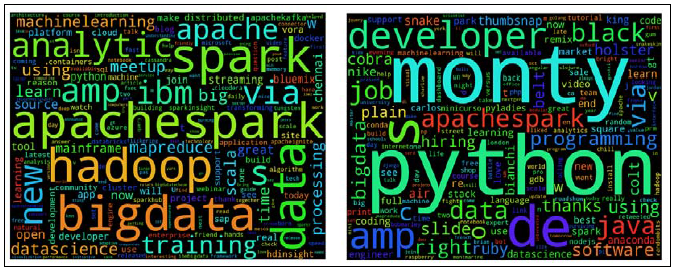
现在我们准备构建wordcloud,这可以告诉我们在这些tweets里哪些是重要的词。通过采集的数据集创建wordclouds
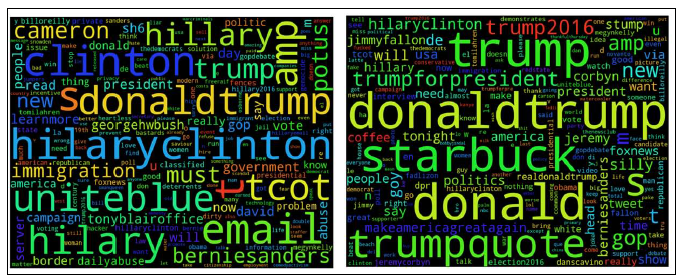
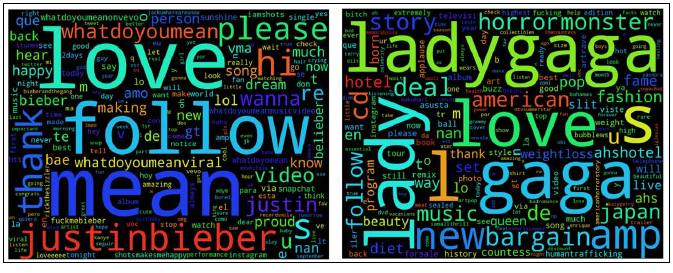
,Wordclouds 提取了高频词汇列表来创建词汇的散点图。数据集中的高频词,在wordcloud渲染时使用比较大的字体。 他们包括三种不同的主题和两个竞争或相似的实体。显然,将Apache Spark和Python 作为数据处理和分析的实体。 第二个主题是 2016 年的总统大选, 两个竞争者: Hilary Clinton and
Donald Trump. 最后一个主题是流行音乐的世界,将 Justin Bieber and
Lady Gaga 作为两个指数.
### 建立wordcloud
通过分析有个Spark 的tweets 来解释编程的步骤,加载数据和预览dataframe:
 In  [21]:
import  pandas  as  pd
csv_in  =  '/home/an/spark/spark-1.5.0-bin-hadoop2.6/examples/AN_Spark/
data/spark_tweets.csv'
tspark_df  =  pd.read_csv(csv_in,  index_col=None,  header=0,  sep=',',
encoding='utf-8')
In  [3]:
tspark_df.head(3)
Out[3]:
id  created_at  user_id user_name   tweet_text  htag    urls
ptxt    tgrp    date    user_handles    txt_terms   search_grp
0   638818911773856000  Tue  Sep  01  21:01:11  +0000  2015 2511247075
Noor  Din   RT  @kdnuggets:  R  leads  RapidMiner,  Python  catc... [#KDN]
[://t.co/3bsaTT7eUs]    r  leads  rapidminer  python  catches  up  big  data
... [spark,  python]2015-09-01  21:01:11[@kdnuggets]r  leads
rapidminer  python  catches  up  big  data  ... [spark,  python]
1   622142176768737000  Fri  Jul  17  20:33:48  +0000  2015 24537879
IBM  Cloudant   Be  one  of  the  first  to  sign-up  for  IBM  Analyti...
[#ApacheSpark,  #SparkInsight]  [://t.co/C5TZpetVA6,  ://t.co/
R1L29DePaQ] be  one  of  the  first  to  sign  up  for  ibm  analyti...
[spark] 2015-07-17  20:33:48
[]  be  one  of  the  first  to  sign  up for  ibm  analyti...
[spark]
2   622140453069169000  Fri  Jul  17  20:26:57  +0000  2015 515145898
Arno  Candel    Nice  article  on  #apachespark,  #hadoop  and  #dat...
[#apachespark,  #hadoop,  #datascience] [://t.co/IyF44pV0f3]    nicearticle  on  apachespark  hadoop  and  datasci...
[spark] 2015-07-17  20:26:57    [@h2oai]    nice  article  on  apachespark  hadoop  and datasci...
注意: wordcloud 库采用了 Andreas Mueller 开发的一个, 位于 https://github.com/amueller/word_cloud.
这个库需要PIL (short for Python Imaging Library).支持 PIL 可以使用conda install pil. 简单地完成安装,PIL 是一个复杂的库还没有移植到Python 3.4, 所以需要运行Python 2.7+ 环境才能 看 wordcloud:
#
#  Install  PIL  (does  not  work  with  Python  3.4)
#
an@an-VB:~$  conda  install  pil

Fetching  package  metadata:  ....
Solving  package  specifications:  ..................
Package  plan  for  installation  in  environment  /home/an/anaconda:
将下载下面的包:
package |   build
---------------------------|-----------------
libpng-1.6.17   |   0   214  KB
freetype-2.5.5  |   0   2.2  MB
conda-env-2.4.4 |   py27_0  24  KB
pil-1.1.7   |   py27_2  650  KB
------------------------------------------------------------
Total:  3.0  MB
更新下面的包:
 conda-env: 2.4.2-py27_0 --> 2.4.4-py27_0
freetype:   2.5.2-0 --> 2.5.5-0
libpng: 1.5.13-1    --> 1.6.17-0
pil:    1.1.7-py27_1 --> 1.1.7-py27_2

Proceed  ([y]/n)?  y
接下来,安装wordcloud 库:
#
#  Install  wordcloud
#  Andreas  Mueller
#  https://github.com/amueller/word_cloud/blob/master/wordcloud/
wordcloud.py
#

an@an-VB:~$  pip  install  wordcloud
Collecting  wordcloud
Downloading  wordcloud-1.1.3.tar.gz  (163kB)
100%  |████████████████████████████████|  163kB  548kB/s
Building  wheels  for  collected  packages:  wordcloud
Running  setup.py  bdist_wheel  for  wordcloud
Stored  in  directory:  /home/an/.cache/pip/wheels/32/a9/74/58e379e5dc6
14bfd9dd9832d67608faac9b2bc6c194d6f6df5
Successfully  built  wordcloud
Installing  collected  packages:  wordcloud
Successfully  installed  wordcloud-1.1.3
创建wordclouds
这一步将利用从tweet文本中生成的词汇列表来生成wordcloud 程序 首先从在notebook中在线调用 %matplotlib 开始:
In  [4]:
%matplotlib  inline
In  [11]:
我们把dataframe 中txt_terms 字段转换成一个单词列表 ,确保全部转换成str 类型以避免不必要的问题并先检查头四条记录 :
len(tspark_df['txt_terms'].tolist())
Out[11]:
2024
In  [22]:
tspark_ls_str  =  [str(t)  for  t  in  tspark_df['txt_terms'].tolist()]
In  [14]:
len(tspark_ls_str)
Out[14]:
2024
In  [15]:
tspark_ls_str[:4]
Out[15]:
['r  leads  rapidminer  python  catches  up  big  data  tools  grow  spark
ignites  kdn',
'be  one  of  the  first  to  sign  up  for  ibm  analytics  for  apachespark
today  sparkinsight',
'nice  article  on  apachespark  hadoop  and  datascience',
'spark  101  running  spark  and  mapreduce  together  in  production
hadoopsummit2015  apachespark  altiscale']
调用Matplotlib 和 wordcloud 库:
import  matplotlib.pyplot  as  plt
from  wordcloud  import  WordCloud,  STOPWORDS
列表中,我们创建一个由空格分隔的统一的字符串作为 wordcloud 程序的输入。wordcloud 程序移除了停词:
#  join  tweets  to  a  single  string
words  =  '  '.join(tspark_ls_str)

#  create  wordcloud
wordcloud  =  WordCloud(
    #  remove  stopwords
    stopwords=STOPWORDS,
    background_color='black',
    width=1800,
    height=1400
    ).generate(words)

#  render  wordcloud  image
plt.imshow(wordcloud)
plt.axis('off')

#  save  wordcloud  image  on  disk
plt.savefig('./spark_tweets_wordcloud_1.png',  dpi=300)

#  display  image  in  Jupyter  notebook
plt.show()
这里,我们可以为Apache Spark and Python可视化wordclouds. 显然,Spark, Hadoop, big data, 和 analytics 是 memes, 当Python强聚焦于developer, apache spark, 以及 java and ruby的编程提示时,使人回忆起它名字的根源Monty Python
我们也看一下2016年总统大选中所关注的词汇形成下面的 wordclouds : Hilary Clinton and
Donald Trump. Hilary Clinton 黯然失色于她竞争对手 Donald Trump and Bernie Sanders, 然而Trump 严重以他自己为中心:
有趣的是, Justin Bieber 和 Lady Gaga 例子中, 出现了 love 一词. In the case of 对于Bieber, follow and belieber 是关键词, 而 diet, weight loss, 和 fashion 是 Lady Gaga 群体的关注点.
tweets定位和 meetups 地图
现在,我们通过Bokeh 深入到交互地图的创建. 首先,创建一个世界地图,那里有我们采样tweet的地理位置信息,把鼠标移动到那些位置 ,可以看到用户与他们相关tweet的悬停框 . 第二幅地图聚焦于伦敦即将到来的 meetups . 这是交互式地图可以作为特定城市即将开始的meetups 时间,日期和位置的提醒。
## Geo-locating tweets
目标是创建一个世界地图,在地图上绘出重要tweet的位置散射点, 在悬停窗口展示 tweets 和做 作者 。通过3步来构建这一虚拟化:
1. 创建一个世界地图,加载一个定义了国家经纬度边界的字典.
2. 加载我们期望的地理位置的重要 tweets 的坐标和作者.
3. 最后,在世界地图上绘制这些tweets 的坐标,以及激活悬停工具来交互性可视化tweets 和它的作者.
第一步,创建一个Python 列表,包含所有国家边界的经纬度:
In  [4]:
#
#  This  module  exposes  geometry  data  for  World  Country  Boundaries.
#
import  csv
import  codecs
import  gzip
import  xml.etree.cElementTree  as  et
import  os
from  os.path  import  dirname,  join

nan  =  float('NaN')
__file__  =  os.getcwd()

data  =  {}
    with  gzip.open(join(dirname(__file__),  'AN_Spark/data/World_Country_
    Boundaries.csv.gz'))  as  f:
    decoded  =  codecs.iterdecode(f,  "utf-8")
    next(decoded)
    reader  =  csv.reader(decoded,  delimiter=',',  quotechar='"')
    for  row  in  reader:
        geometry,  code,  name  =  row
        xml  =  et.fromstring(geometry)
        lats  =  []
        lons  =  []
        for  i,  poly  in  enumerate(xml.findall('.//outerBoundaryIs/
        LinearRing/coordinates')):
            if  i  >  0:
                lats.append(nan)
                lons.append(nan)
            coords  =  (c.split(',')[:2]  for  c  in  poly.text.split())
            lat,  lon  =  list(zip(*[(float(lat),  float(lon))  for  lon,lat  in coords]))
            lats.extend(lat)
            lons.extend(lon)
            data[code]  =  {
                'name'  :  name,
                'lats'  :  lats,
                'lons'  :  lons,
                }
In  [5]:
len(data)
Out[5]:
235
第二步, 加载重要tweets的抽样集 以便于可视化相应的地理信息:
In  [69]:
#  data
#
#
In  [8]:
import  pandas  as  pd
csv_in  =  '/home/an/spark/spark-1.5.0-bin-hadoop2.6/examples/AN_Spark/
data/spark_tweets_20.csv'
t20_df  =  pd.read_csv(csv_in,  index_col=None,  header=0,  sep=',',
encoding='utf-8')
In  [9]:
t20_df.head(3)
Out[9]:
id  created_at  user_id user_name   tweet_text  htag    urls
ptxt    tgrp    date    user_handles    txt_terms   search_grp  lat
lon
0   638818911773856000  Tue  Sep  01  21:01:11  +0000  2015 2511247075
Noor  Din   RT  @kdnuggets:  R  leads  RapidMiner,  Python  catc... [#KDN]
[://t.co/3bsaTT7eUs]    r  leads  rapidminer  python  catches  up  big  data
... [spark,  python]2015-09-01  21:01:11[@kdnuggets]r
leads  rapidminer  python  catches  up  big  data  ...  [spark,  python]
37.279518   -121.867905
1   622142176768737000  Fri  Jul  17  20:33:48  +0000  2015 24537879
IBM  Cloudant   Be  one  of  the  first  to  sign-up  for  IBM  Analyti...
[#ApacheSpark,  #SparkInsight]  [://t.co/C5TZpetVA6,  ://t.co/
R1L29DePaQ] be  one  of  the  first  to  sign  up  for  ibm  analyti...
[spark] 2015-07-17  20:33:48    []  be  one  of  the  first  to  sign  up
for  ibm  analyti...    [spark] 37.774930   -122.419420
2   622140453069169000  Fri  Jul  17  20:26:57  +0000  2015 515145898
Arno  Candel    Nice  article  on  #apachespark,  #hadoop  and  #dat...
[#apachespark,  #hadoop,  #datascience] [://t.co/IyF44pV0f3]    nice
article  on  apachespark  hadoop  and  datasci...   [spark] 2015-07-
17  20:26:57    [@h2oai]    nice  article  on  apachespark  hadoop  and
datasci...  [spark] 51.500130   -0.126305
In  [98]:
len(t20_df.user_id.unique())
Out[98]:
19
In  [17]:
t20_geo  =  t20_df[['date',  'lat',  'lon',  'user_name',  'tweet_text']]
In  [24]:
#
t20_geo.rename(columns={'user_name':'user',  'tweet_text':'text'  },
inplace=True)
In  [25]:
t20_geo.head(4)
Out[25]:
date    lat lon user    text
0   2015-09-01  21:01:11    37.279518   -121.867905 Noor  Din   RT
@kdnuggets:  R  leads  RapidMiner,  Python  catc...
1   2015-07-17  20:33:48    37.774930   -122.419420 IBM  Cloudant
Be  one  of  the  first  to  sign-up  for  IBM  Analyti...
2   2015-07-17  20:26:57    51.500130   -0.126305   Arno  Candel
Nice  article  on  #apachespark,  #hadoop  and  #dat...
3   2015-07-17  19:35:31    51.500130   -0.126305   Ira  Michael
Blonder Spark  101:  Running  Spark  and  #MapReduce  togeth...
In  [22]:
df  =  t20_geo
#
第三步,先倒入 Bokeh 库. 将在Jupyter Notebook 实例化输出, 获得加载的国家边界的信息,得到 该位置的 tweet 数据. 实例化Bokeh交互工具如 wheel 和 box zoom 以及悬停工具.
In  [29]:
#
#  Bokeh  Visualization  of  tweets  on  world  map
#
from  bokeh.plotting  import  *
from  bokeh.models  import  HoverTool,  ColumnDataSource
from  collections  import  OrderedDict

#  Output  in  Jupiter  Notebook
output_notebook()

#  Get  the  world  map
world_countries  =  data.copy()

#  Get  the  tweet  data
tweets_source  =  ColumnDataSource(df)

#  Create  world  map

countries_source  =  ColumnDataSource(data=  dict(
countries_xs=[world_countries[code]['lons']  for  code  in  world_countries],
countries_ys=[world_countries[code]['lats']  for  code  in  world_countries],
country  =  [world_countries[code]['name']  for  code  in  world_
countries],))

#  Instantiate  the  bokeh  interactive  tools
TOOLS="pan,wheel_zoom,box_zoom,reset,resize,hover,save"
现在可以将各种收集的元素放入一个图片对象p. 定义p的标题,宽度和 高度. 创建世界地图背景并高亮背景颜色和边界. 根据位置坐标, 散点描绘相应的tweets . 然后,在用户和他们相应的tweet上激活悬停工具. 最后, 在浏览器中渲染图片。代码如下:
# Instantiante the figure object
p = figure(
title="%s tweets " %(str(len(df.index))),
title_text_font_size="20pt",
plot_width=1000,
plot_height=600,
tools=TOOLS)
# Create world patches background
p.patches(xs="countries_xs", ys="countries_ys", source = countries_source, fill_color="#F1EEF6", fill_alpha=0.3,
line_color="#999999", line_width=0.5)
# Scatter plots by longitude and latitude
p.scatter(x="lon", y="lat", source=tweets_source, fill_
color="#FF0000", line_color="#FF0000")
#
# Activate hover tool with user and corresponding tweet information
hover = p.select(dict(type=HoverTool))
hover.point_policy = "follow_mouse"
hover.tooltips = OrderedDict([
("user", "@user"),
("tweet", "@text"),
])
# Render the figure on the browser
show(p)
BokehJS successfully loaded.
inspect
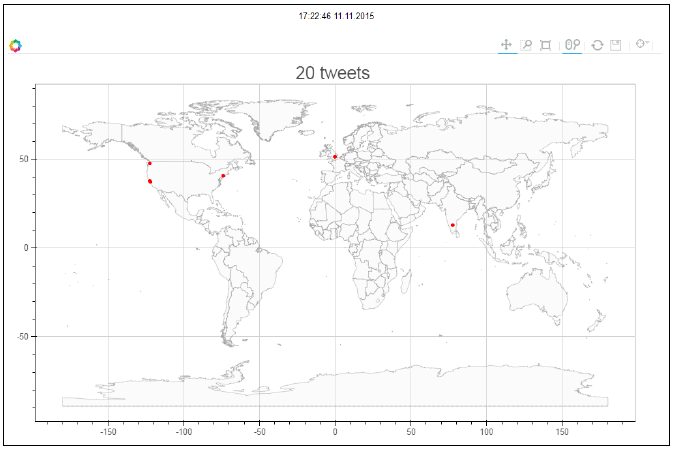
#下面的代码给出了世界地图的概貌,红点表明了tweets的原始位置:
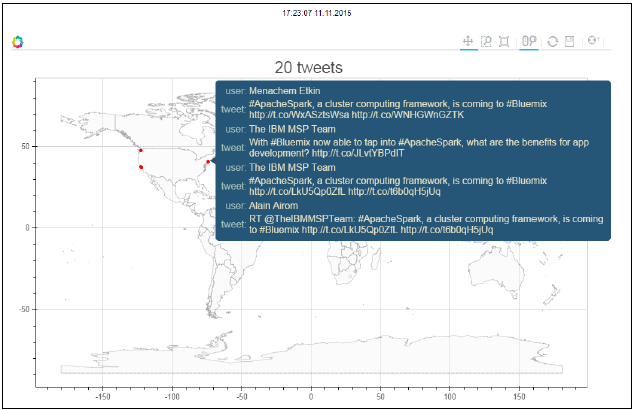
悬停在一个特殊的点,得到该位置的tweets:
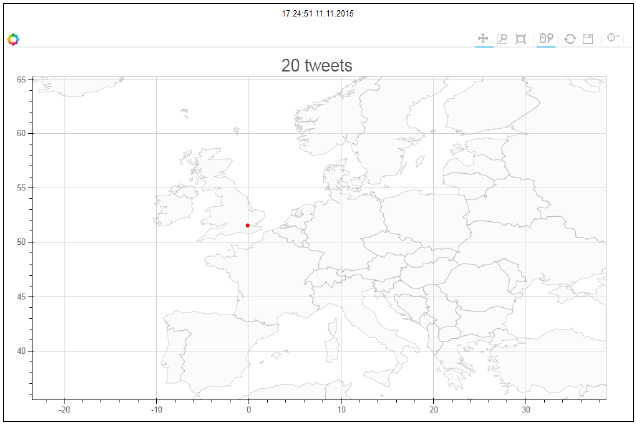
能够放大特定的位置:
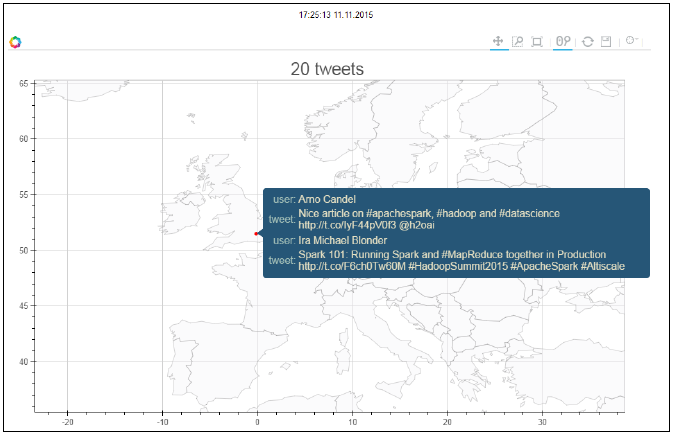
最后, 我们能够在指定放大区域展示tweets :
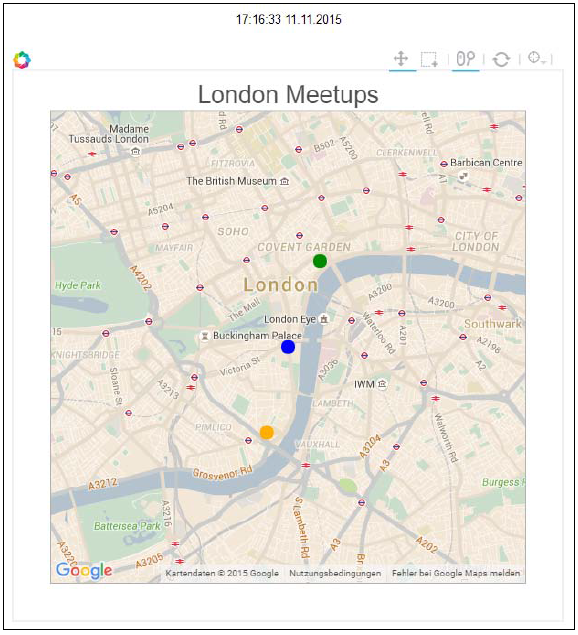
在Google地图显示即将到来的meetups
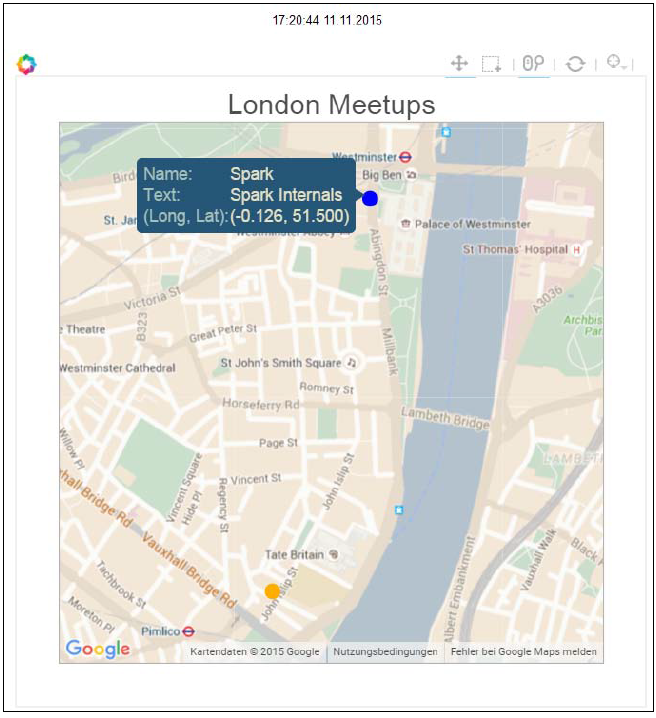
现在,目标聚焦于在伦敦即将到了聚会。 我们映射三个聚会 Data Science London, Apache Spark, 和 Machine Learning. 将Google Map 嵌入到 Bokeh 可视化中,根据它们的坐标得到三个聚会的地理位置 ,得到悬停工窗口所显示的信息,例如每个聚会的名称。
首先, 导入所需的 Bokeh 库:
In  [  ]:
#
#  Bokeh  Google  Map  Visualization  of  London  with  hover  on  specific
points
#
#
from  __future__  import  print_function
from bokeh.browserlib  import  view
from bokeh.document  import  Document
from bokeh.embed  import  file_html
from bokeh.models.glyphs  import  Circle
from bokeh.models  import  (
GMapPlot,  Range1d,  ColumnDataSource,
PanTool,  WheelZoomTool,  BoxSelectTool,
HoverTool,  ResetTool,
BoxSelectionOverlay,  GMapOptions)
from  bokeh.resources  import  INLINE

x_range  =  Range1d()
y_range  =  Range1d()
将实例化 Google Map 作为底图, Bokeh visualization 覆盖在上面:
#  JSON  style  string  taken  from: https://snazzymaps.com/style/1/pale-dawn


map_options  =  GMapOptions(lat=51.50013,  lng=-0.126305,  map_
type="roadmap",  zoom=13,  styles="""
[{"featureType":"administrative","elementType":"all","stylers":[{"visi
bility":"on"},{"lightness":33}]},
{"featureType":"landscape","elementType":"all","stylers":[{"color":"
#f2e5d4"}]},
{"featureType":"poi.park","elementType":"geometry","stylers":[{"color
":"#c5dac6"}]},
{"featureType":"poi.park","elementType":"labels","stylers":[{"visibil
ity":"on"},{"lightness":20}]},
{"featureType":"road","elementType":"all","stylers":[{"lightne
ss":20}]},
{"featureType":"road.highway","elementType":"geometry","stylers":[{"c
olor":"#c5c6c6"}]},
{"featureType":"road.arterial","elementType":"geometry","stylers":[{"
color":"#e4d7c6"}]},
{"featureType":"road.local","elementType":"geometry","stylers":[{"col
or":"#fbfaf7"}]},
{"featureType":"water","elementType":"all","stylers":[{"visibility":"
on"},{"color":"#acbcc9"}]}]
""")
从GMapPlot 类实例化 拥有维度的Bokeh 对象,以及前面步骤的地图选项:
#  Instantiate  Google  Map  Plot
plot  =  GMapPlot(
x_range=x_range,  y_range=y_range,
map_options=map_options,
title="London  Meetups"
)
拿到我们将要绘制的三个聚会信息,并得到根据相应坐标的悬停窗口所展示的信息:
source  =  ColumnDataSource(
    data=dict(
    lat=[51.49013,  51.50013,  51.51013],
    lon=[-0.130305,  -0.126305,  -0.120305],
    fill=['orange',  'blue',  'green'],
    name=['LondonDataScience',  'Spark',  'MachineLearning'],
    text=['Graph  Data  &  Algorithms','Spark  Internals','Deep
    Learning  on  Spark']
    )
)
在Google Map上定义被画的点:
circle  =  Circle(x="lon",  y="lat",  size=15,  fill_color="fill",  line_
color=None)
plot.add_glyph(source,  circle)
定义在这个可视化中 Bokeh 工具所需的字符串:
#
TOOLS="pan,wheel_zoom,box_zoom,reset,hover,save"
pan = PanTool()
wheel_zoom = WheelZoomTool()
box_select = BoxSelectTool()
reset = ResetTool()
hover = HoverTool()
# save = SaveTool()
plot.add_tools(pan, wheel_zoom, box_select, reset, hover)
overlay = BoxSelectionOverlay(tool=box_select)
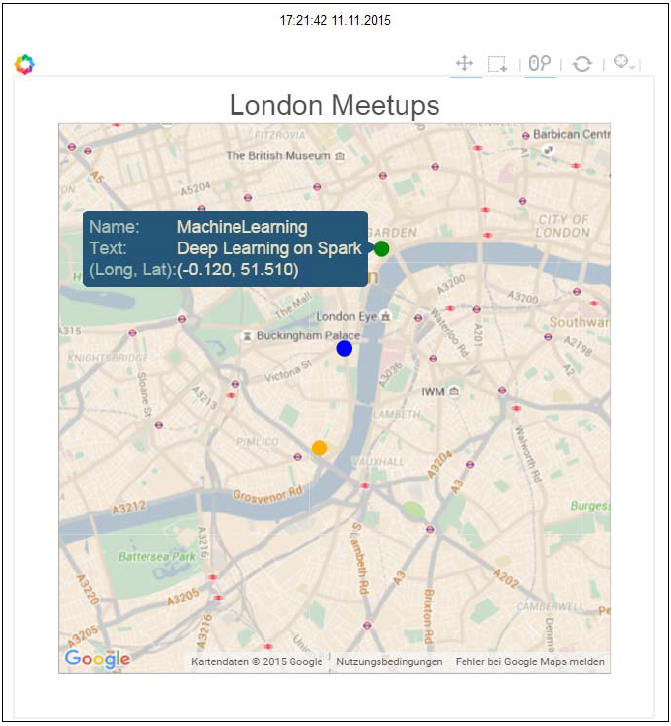
plot.add_layout(overlay)激活悬停工具所携带的信息:
hover  =  plot.select(dict(type=HoverTool))
hover.point_policy  =  "follow_mouse"
hover.tooltips  =  OrderedDict([
("Name",  "@name"),
("Text",  "@text"),
("(Long,  Lat)",  "(@lon,  @lat)"),
])

show(plot)
渲染绘图就可以得到伦敦的一个漂亮视图:
一旦我们悬停在一个高亮的点上,就可以得到给定聚会的信息:
保留了全部平滑缩放的能力,如下面的截图所示: