前言
prometheus在容器云的领域实力毋庸置疑,越来越多的云原生组件直接提供prometheus的metrics接口,无需额外的exporter。所以采用prometheus作为整个集群的监控方案是合适的。但是metrics的存储这块,prometheus提供了本地 存储,即tsdb时序数据库。本地存储的优势就是运维简单,启动prometheus只需一个命令,下面两个启动参数指定了数据路径和保存时间。
- storage.tsdb.path: tsdb数据库路径,默认 data/
- storage.tsdb.retention: 数据保留时间,默认15天
缺点就是无法大量的metrics持久化。当然prometheus2.0以后压缩数据能力得到了很大的提升。
为了解决单节点存储的限制,prometheus没有自己实现集群存储,而是提供了远程读写的接口,让用户自己选择合适的时序数据库来实现prometheus的扩展性。
prometheus通过下面两张方式来实现与其他的远端存储系统对接
- Prometheus 按照标准的格式将metrics写到远端存储
- prometheus 按照标准格式从远端的url来读取metrics
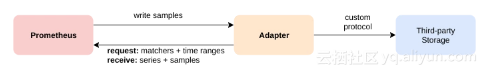
下面我将重点剖析远端存储的方案
远端存储方案
配置文件
远程写
# The URL of the endpoint to send samples to.
url: <string>

# Timeout for requests to the remote write endpoint.
[ remote_timeout: <duration> | default = 30s ]

# List of remote write relabel configurations.
write_relabel_configs:
 [ - <relabel_config> ... ]

# Sets the `Authorization` header on every remote write request with the # configured username and password. # password and password_file are mutually exclusive.
basic_auth:
 [ username: <string> ]
 [ password: <string> ]
 [ password_file: <string> ]

# Sets the `Authorization` header on every remote write request with # the configured bearer token. It is mutually exclusive with `bearer_token_file`.
[ bearer_token: <string> ]

# Sets the `Authorization` header on every remote write request with the bearer token # read from the configured file. It is mutually exclusive with `bearer_token`.
[ bearer_token_file: /path/to/bearer/token/file ]

# Configures the remote write request's TLS settings.
tls_config:
 [ <tls_config> ]

# Optional proxy URL.
[ proxy_url: <string> ]

# Configures the queue used to write to remote storage.
queue_config:
 # Number of samples to buffer per shard before we start dropping them.
 [ capacity: <int> | default = 100000 ]
 # Maximum number of shards, i.e. amount of concurrency.
 [ max_shards: <int> | default = 1000 ]
 # Maximum number of samples per send.
 [ max_samples_per_send: <int> | default = 100]
 # Maximum time a sample will wait in buffer.
 [ batch_send_deadline: <duration> | default = 5s ]
 # Maximum number of times to retry a batch on recoverable errors.
 [ max_retries: <int> | default = 10 ]
 # Initial retry delay. Gets doubled for every retry.
 [ min_backoff: <duration> | default = 30ms ]
 # Maximum retry delay.
 [ max_backoff: <duration> | default = 100ms ]
远程读
# The URL of the endpoint to query from.
url: <string>

# An optional list of equality matchers which have to be # present in a selector to query the remote read endpoint.
required_matchers:
 [ <labelname>: <labelvalue> ... ]

# Timeout for requests to the remote read endpoint.
[ remote_timeout: <duration> | default = 1m ]

# Whether reads should be made for queries for time ranges that # the local storage should have complete data for.
[ read_recent: <boolean> | default = false ]

# Sets the `Authorization` header on every remote read request with the # configured username and password. # password and password_file are mutually exclusive.
basic_auth:
 [ username: <string> ]
 [ password: <string> ]
 [ password_file: <string> ]

# Sets the `Authorization` header on every remote read request with # the configured bearer token. It is mutually exclusive with `bearer_token_file`.
[ bearer_token: <string> ]

# Sets the `Authorization` header on every remote read request with the bearer token # read from the configured file. It is mutually exclusive with `bearer_token`.
[ bearer_token_file: /path/to/bearer/token/file ]

# Configures the remote read request's TLS settings.
tls_config:
 [ <tls_config> ]

# Optional proxy URL.
[ proxy_url: <string> ]
PS
- 远程写配置中的write_relabel_configs 该配置项,充分利用了prometheus强大的relabel的功能。可以过滤需要写到远端存储的metrics。
例如:选择指定的metrics。
remote_write:
 - url: "http://prometheus-remote-storage-adapter-svc:9201/write"  write_relabel_configs:
 - action: keep
 source_labels: [__name__]
regex: container_network_receive_bytes_total|container_network_receive_packets_dropped_total- global配置中external_labels,在prometheus的联邦和远程读写的可以考虑设置该配置项,从而区分各个集群。
global: scrape_interval: 20s # The labels to add to any time series or alerts when communicating with # external systems (federation, remote storage, Alertmanager). external_labels: cid: '9'已有的远端存储的方案
现在社区已经实现了以下的远程存储方案
- AppOptics: write
- Chronix: write
- Cortex: read and write
- CrateDB: read and write
- Elasticsearch: write
- Gnocchi: write
- Graphite: write
- InfluxDB: read and write
- OpenTSDB: write
- PostgreSQL/TimescaleDB: read and write
- SignalFx: write
上面有些存储是只支持写的。其实研读源码,能否支持远程读,
取决于该存储是否支持正则表达式的查询匹配。具体实现下一节,将会解读一下prometheus-postgresql-adapter和如何实现一个自己的adapter。
同时支持远程读写的
- Cortex来源于weave公司,整个架构对prometheus做了上层的封装,用到了很多组件。稍微复杂。
- InfluxDB 开源版不支持集群。对于metrics量比较大的,写入压力大,然后influxdb-relay方案并不是真正的高可用。当然饿了么开源了influxdb-proxy,有兴趣的可以尝试一下。
- CrateDB 基于es。具体了解不多
- TimescaleDB 个人比较中意该方案。传统运维对pgsql熟悉度高,运维靠谱。目前支持 streaming replication方案支持高可用。
后记
其实如果收集的metrics用于数据分析,可以考虑clickhouse数据库,集群方案和写入性能以及支持远程读写。这块正在研究中。待有了一定成果以后再专门写一篇文章解读。目前我们的持久化方案准备用TimescaleDB。
本文转自SegmentFault-k8s与监控--prometheus的远端存储