【译Py】Python交互式数据分析报告框架~Dash介绍
【译Py】Dash用户指南01-02_安装与应用布局
【译Py】Dash用户指南03_交互性简介
【译Py】Dash用户指南04_交互式数据图
【译Py】Dash用户指南05_使用State进行回调
1. 安装
Dash需要安装以下几个库才能正常使用,这些库仍在不断更新,请注意及时升级。
Dash支持Python2与Python3。
pip install dash==0.25.0  # Dash核心后端
pip install dash-renderer==0.13.2  # Dash前端
pip install dash-html-components==0.11.0  # HTML组件
pip install dash-core-components==0.27.1  # Dash核心组件
pip install plotly --upgrade  # Plotly图形库
译注:通过以下链接查看Dash及其支持库的最新版本。
2. Dash应用布局
本教程通过6个例子介绍如何创建Dash应用。
使用Dash生成HTML
Dash应用由两部分组成,第一部分是应用的布局即layout,描述应用的设计样式。第二部分描述应用的交互性。
Dash为每个可视化组件都提供了Python类,Plotly提供的dash_core_components 与 dash_html_components组件库包含了一系列Dash组件,如果这些还不够,可以使用JavaScript 和React.js创建更多组件。
首先,新建 app.py文件,输入以下代码:
# -*- coding: utf-8 -*-
import dash
import dash_core_components as dcc
import dash_html_components as html
app = dash.Dash()
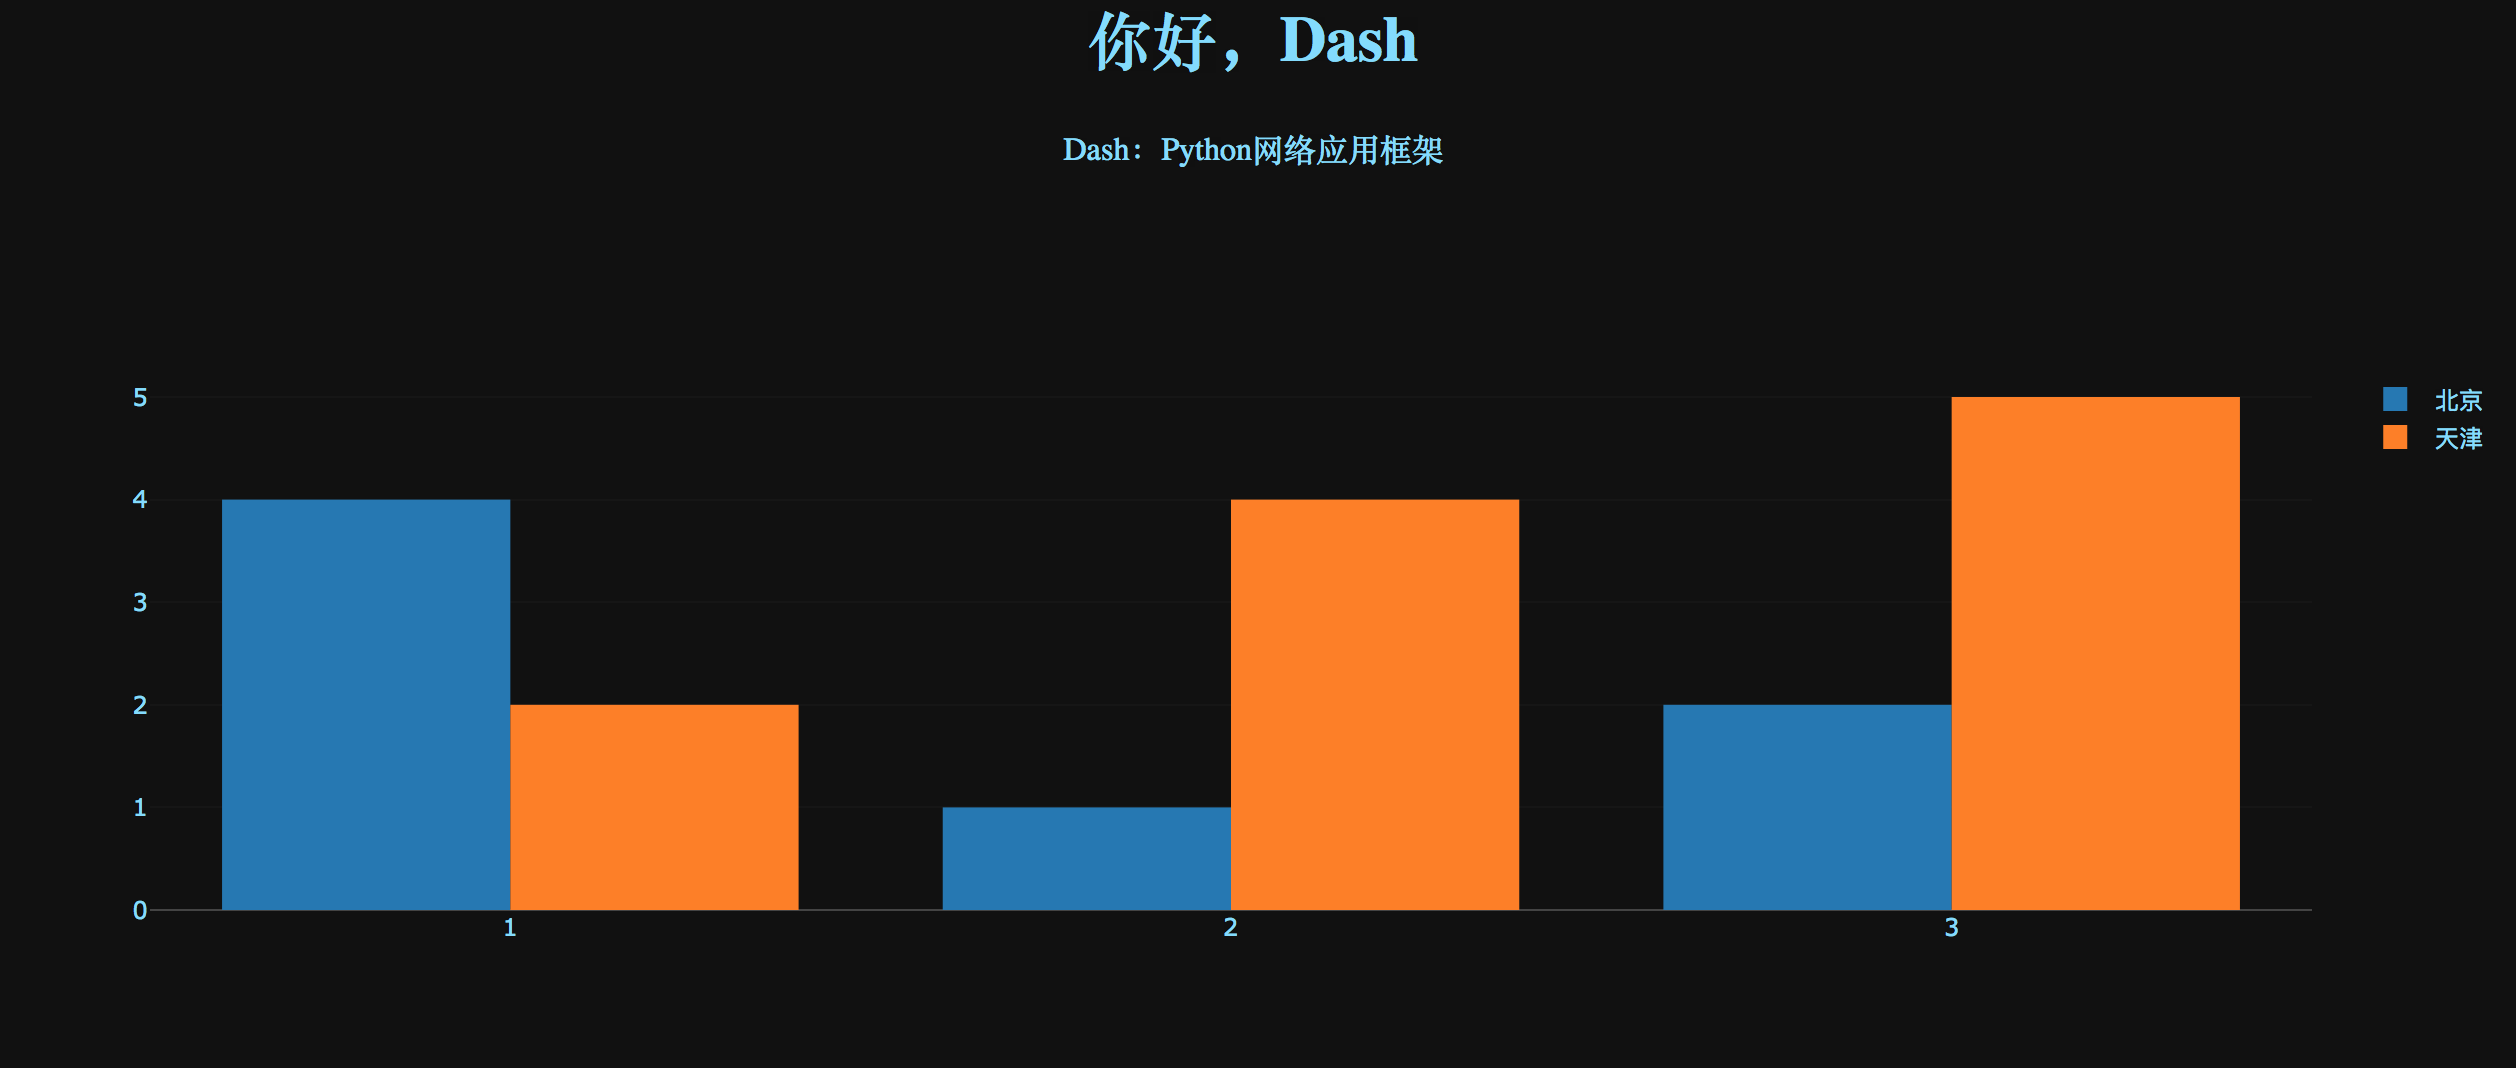
app.layout = html.Div(children=[
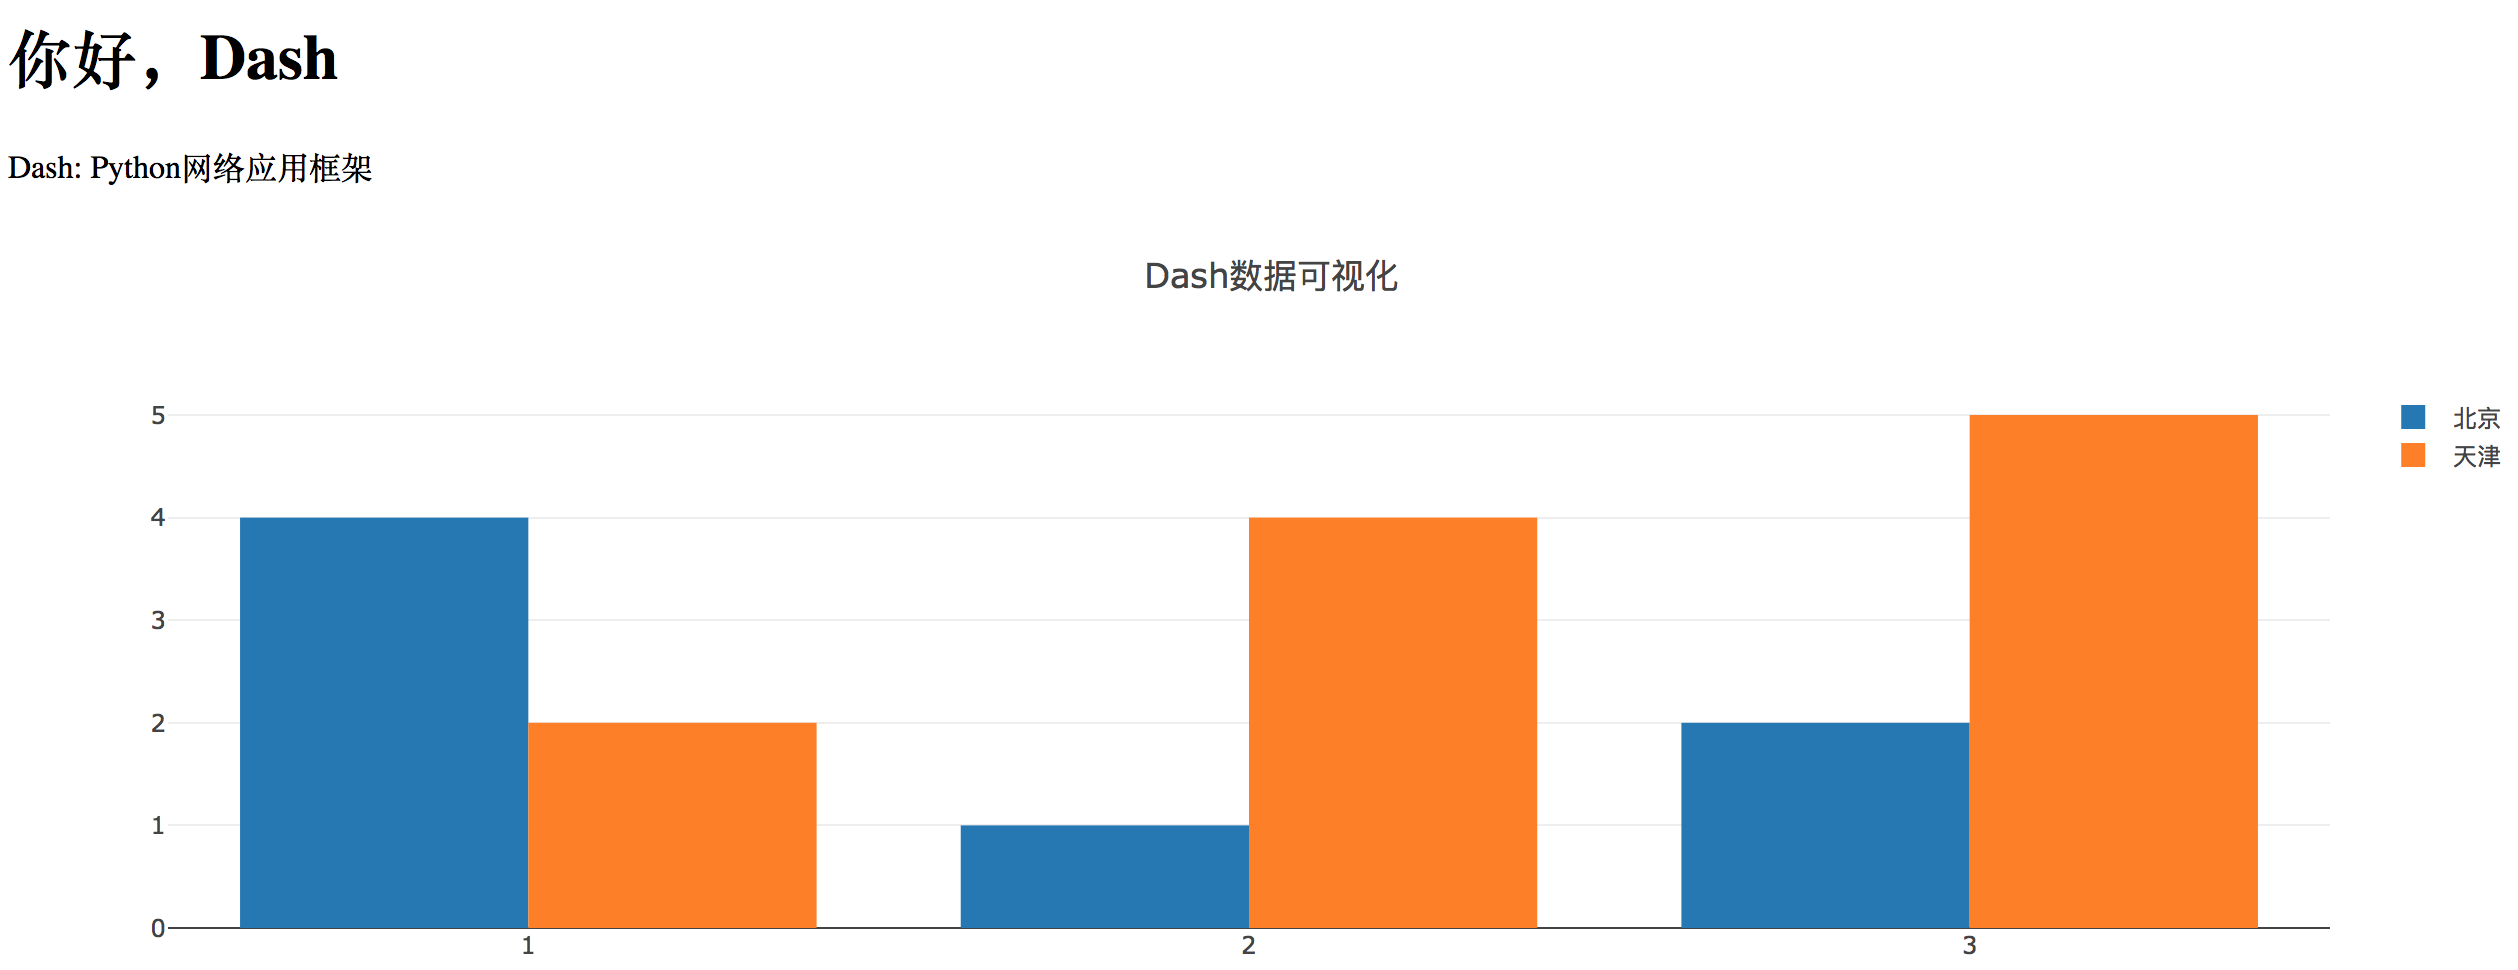
html.H1(children='你好,Dash'),
html.Div(children='''
Dash: Python网络应用框架'''),
dcc.Graph(
id='example-graph',
figure={
'data': [
{'x': [1, 2, 3], 'y': [4, 1, 2], 'type': 'bar', 'name': '北京'},
{'x': [1, 2, 3], 'y': [2, 4, 5], 'type': 'bar', 'name': '天津'},
],
'layout': {
'title': 'Dash数据可视化'
}
}
)
])
if __name__ == '__main__':
app.run_server(debug=True)
运行以下语句:
$ python app.py
...Running on http://127.0.0.1:8050/ (Press CTRL+C to quit)
在浏览器中访问 http://127.0.0.1:8050/ ,就可看到下图所示内容。
注意:
-
layout由html.Div与dcc.Graph这样的组件树组成。 -
dash_html_components库为每个HTML标签都提供了对应的组件。html.H1(children='你好,Dash')组件可以生成<h1>你好,Dash</h1>这样的HTML语句。 - 并非所有组件都使用纯HTML语言。
dash_core_components这种交互式高阶组件库,就是由JavaScript、HTML和CSS编写,并由React.js库生成的。 - Dash是声明式的,可以用关键字的属性描述组件。即,Dash主要通过属性描述应用。
-
children特性[1]有些特殊。一般来说,它是第一个属性[2],可以省略:html.H1(children = '你好, Dash')与html.H1('你好,Dash')的效果一样。此特性支持字符串、数字、单个组件或组件列表。 - 你的应用字体看上去可能与本教程显示的不一样,这是因为本教程的应用使用了自定义CSS样式,修改了默认元素的格式。要了解更多内容,可以查阅CSS教程。如果需要,可以添加
app.css.append_css({"external_url": "https://codepen.io/chriddyp/pen/bWLwgP.css"})至本文件,就能呈现出与本例相同的效果。
关于HTML更多的内容
dash_html_components 库除了为HTML参数提供了关键字外,还为每个HTML标签提供了组件类。
在Dash应用中,可以使用以下代码通过组件的行内样式修改自定义文本。
# _*_ coding: utf-8 _*_
import dash
import dash_core_components as dcc
import dash_html_components as html

app = dash.Dash()

colors = {
    'background': '#111111',
    'text': '#7FDBFF'
}

app.layout = html.Div(style={'backgroundColor': colors['background']},
                      children=[
    html.H1(
        children='你好,Dash',
        style={
            'textAlign': 'center',
            'color': colors['text']
        }
    ),
    html.Div(children='Dash:Python网络应用框架', style={
        'textAlign': 'center',
        'color': colors['text']
    }),
    dcc.Graph(
        id='example-graph-2',
        figure={
            'data': [
                {'x': [1, 2, 3], 'y':[4, 1, 2], 'type':'bar', 'name':'北京'},
                {'x': [1, 2, 3], 'y':[2, 4, 5], 'type':'bar', 'name':'天津'},
            ],
            'layout':{
                'plot_bgcolor': colors['background'],
                'paper_bgcolor': colors['background'],
                'font':{
                    'color': colors['text']
                }
            }
        }

    )

])

if __name__ == '__main__':
    app.run_server(debug=True)
本例中,用style特性修改html.Div与html.H1组件的行内样式。
Dash应用把html.H1('你好,Dash', style={'textAlign': 'center', 'color': '#7FDFF'}) 渲染为 <h1 style="text-align: center; color: #7FDFF">你好,Dash</h1>。
dash_html_components与HTML属性有以下几点显著区别:
- HTML的
style特性是用分号分割的字符串,Dash用的是字典; - Dash的
style字典关键字是驼峰式,相对于HTML的text-align,Dash是textAlign; - HTML的
class属性在Dash中是className; - HTML标签的子项(即
children)是通过children关键字指定的。一般来说,作为第一个参数,可以省略。
除此之外,其他所有HTML属性与标签在Python中都有效。
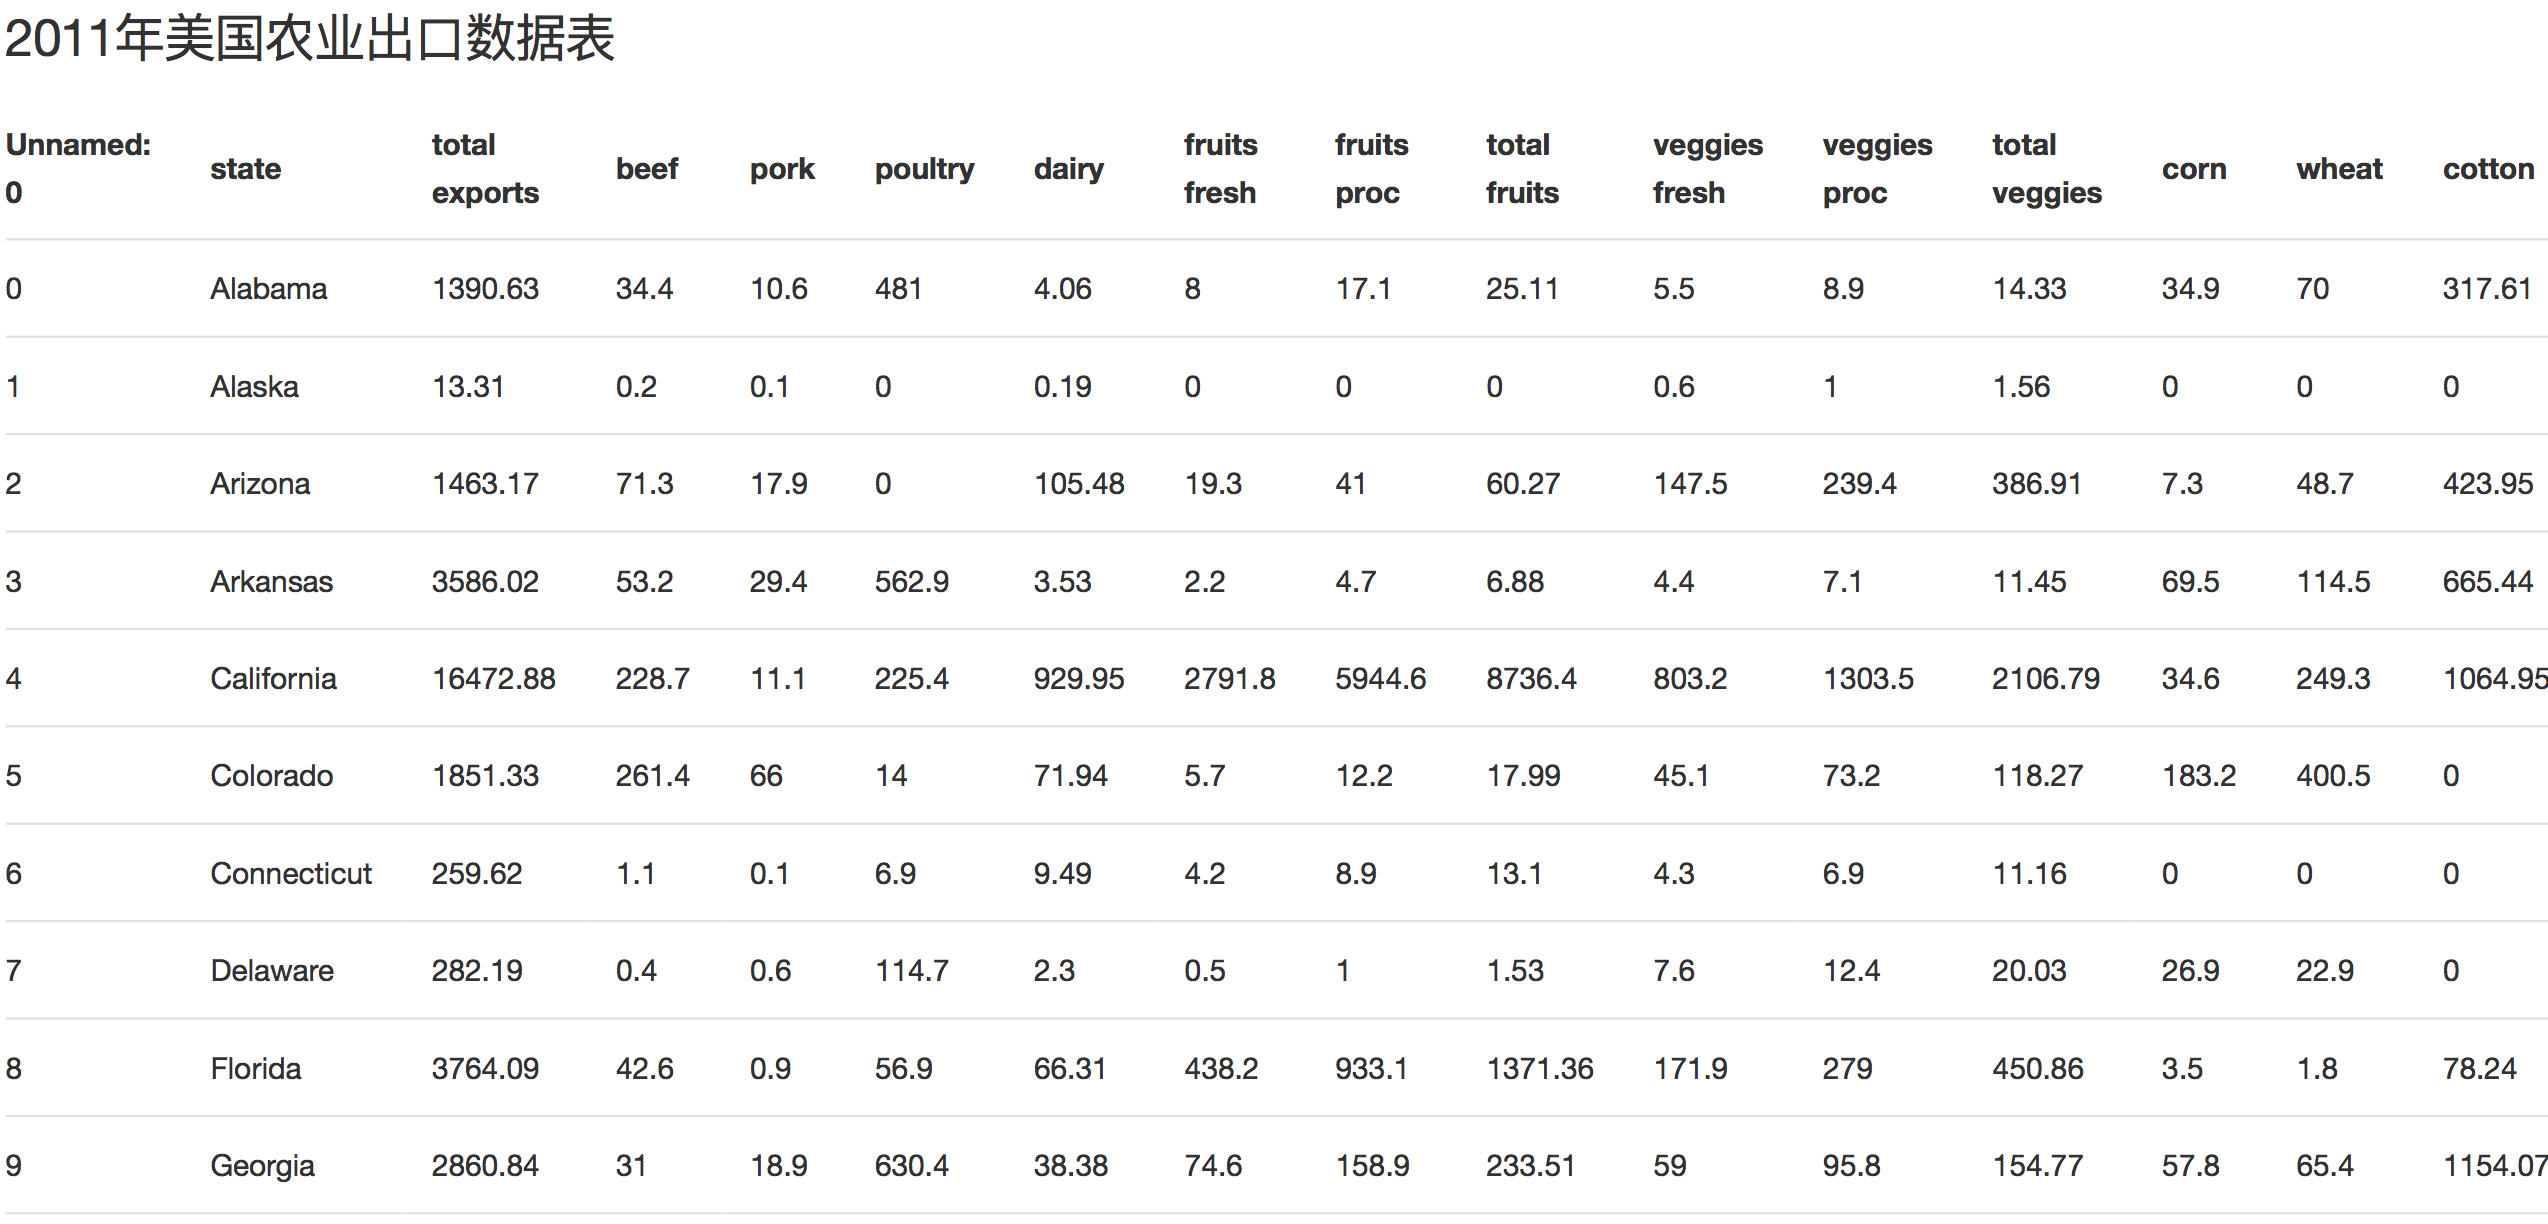
可复用组件
在Python中写入标记符号(Markup),即可创建表格等可复用组件,无需切换环境或语言。
下面是用Pandas DataFrame生成表格的例子。
# -*- coding: utf-8 -*-
import dash
import dash_core_components as dcc
import dash_html_components as html
import pandas as pd

df = pd.read_csv(
    'https://gist.githubusercontent.com/chriddyp/'
    'c78bf172206ce24f77d6363a2d754b59/raw/'
    'c353e8ef842413cae56ae3920b8fd78468aa4cb2/'
    'usa-agricultural-exports-2011.csv')


def generate_talbe(dataframe, max_rows=10):
    return html.Table(
        # Header
        [html.Tr([html.Th(col) for col in dataframe.columns])] +

        # Body
        [html.Tr([
            html.Td(dataframe.iloc[i][col]) for col in dataframe.columns
        ]) for i in range(min(len(dataframe), max_rows))]
    )


app = dash.Dash()

app.css.append_css(
    {"external_url": "https://codepen.io/chriddyp/pen/bWLwgP.css"})

app.layout = html.Div(children=[
    html.H4(children='2011年美国农业出口数据表'),
    generate_talbe(df)
])
if __name__ == '__main__':
    app.run_server(debug=True)
可视化示例
下面的例子用Pandas DataFrame创建散点图。
# -*- coding: utf-8 -*-
import dash
import pandas as pd
import plotly.graph_objs as go
import dash_core_components as dcc
import dash_html_components as html

app = dash.Dash()

df = pd.read_csv(
    'https://gist.githubusercontent.com/chriddyp/' +
    '5d1ea79569ed194d432e56108a04d188/raw/' +
    'a9f9e8076b837d541398e999dcbac2b2826a81f8/' +
    'gdp-life-exp-2007.csv')

app.layout = html.Div([
    dcc.Graph(
        id='life-exp-vs-gdp',
        figure={
            'data': [
                go.Scatter(
                    x=df[df['continent'] == i]['gdp per capita'],
                    y=df[df['continent'] == i]['life expectancy'],
                    text=df[df['continent'] == i]['country'],
                    mode='markers',
                    opacity=0.7,
                    marker={
                        'size': 15,
                        'line': {'width': 0.5, 'color': 'white'}
                    },
                    name=i
                ) for i in df.continent.unique()
            ],
            'layout': go.Layout(
                xaxis={'type': 'log', 'title': '人均GDP'},
                yaxis={'title': '平均寿命'},
                margin={'l': 40, 'b': 40, 't': 10, 'r': 10},
                legend={'x': 0, 'y': 1},
                hovermode='closest'
            )
        }
    )
])

if __name__ == '__main__':
    app.run_server()
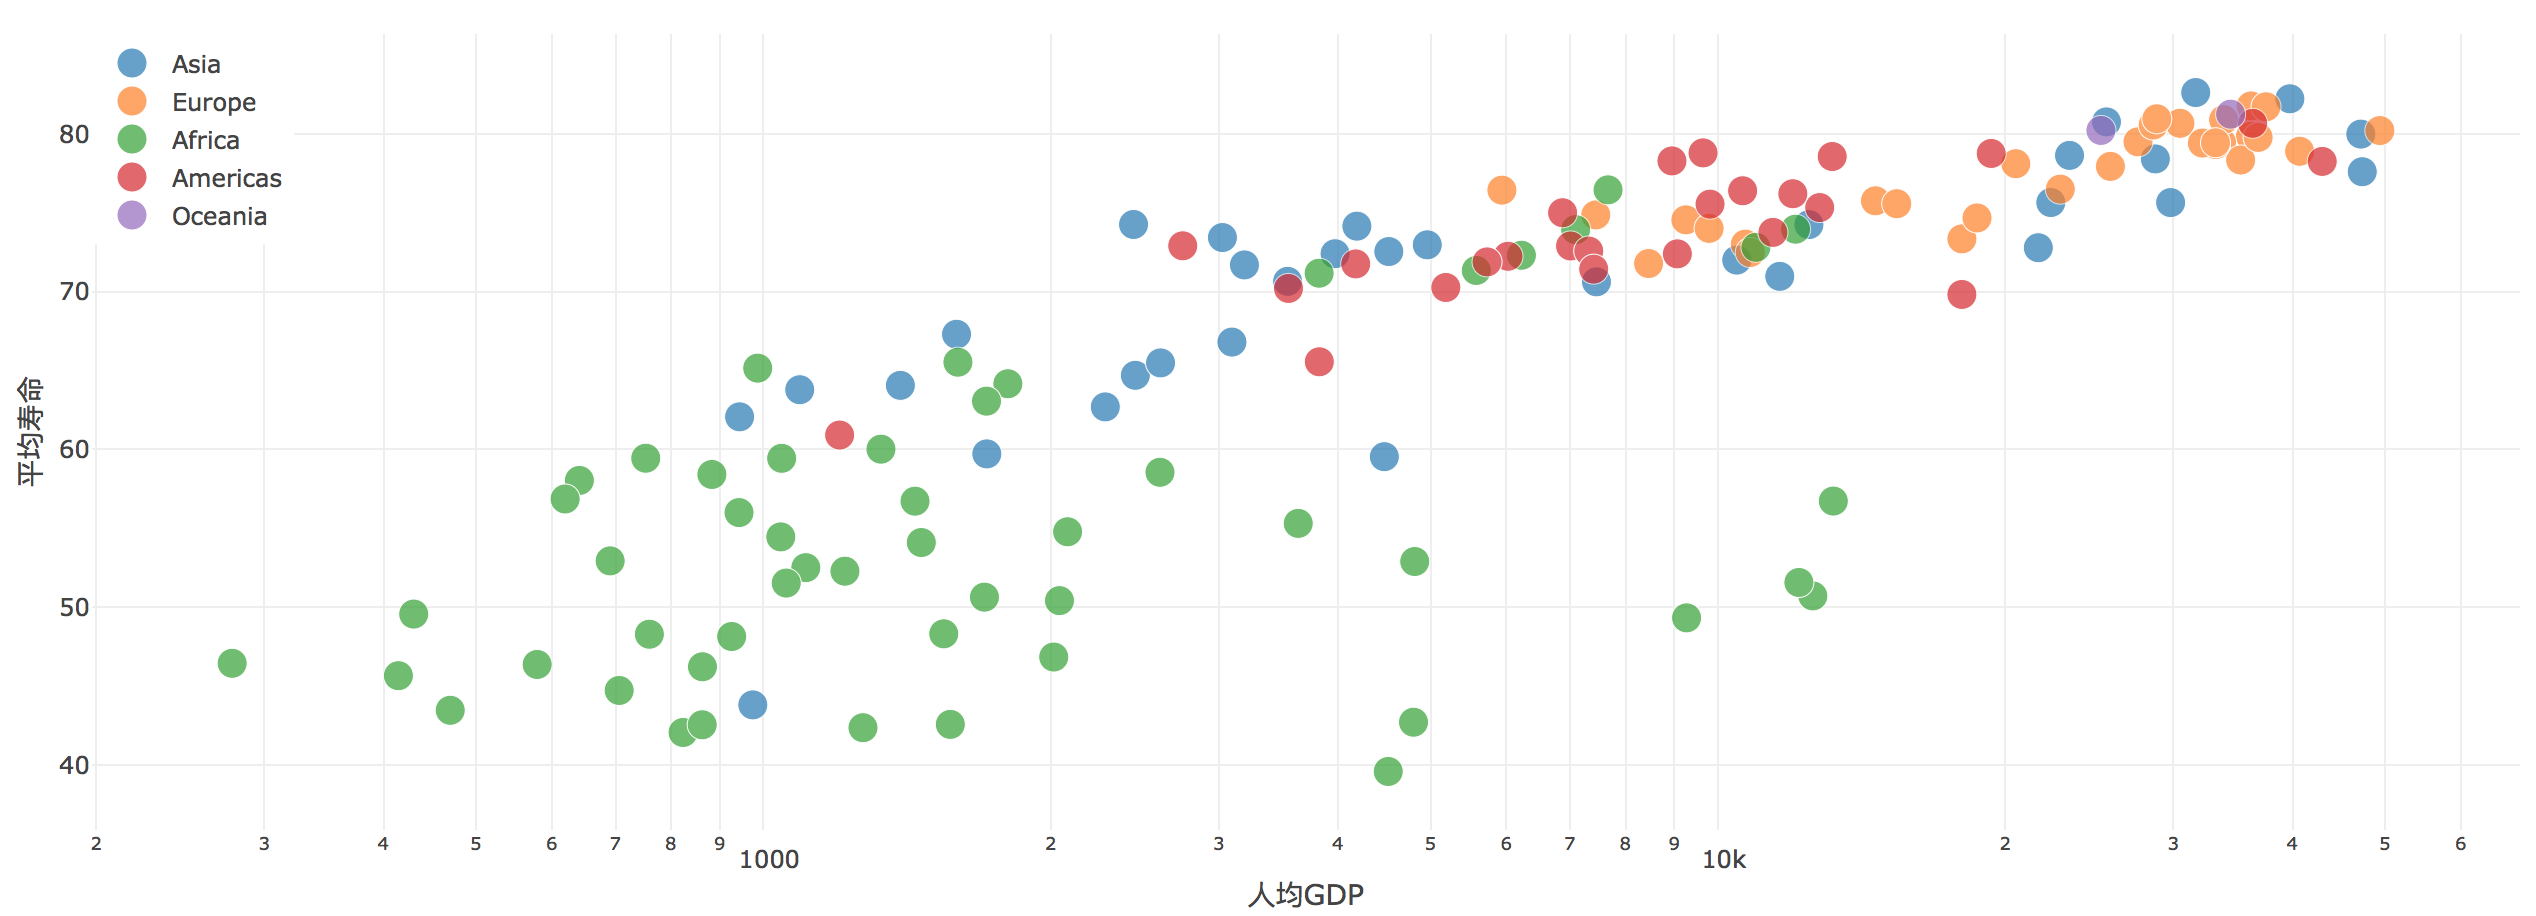
这些图支持交互响应。鼠标悬浮在点上可查看数据的值,点击图例可切换展示的内容,点击拖拽可缩放图形,按下Shift键,再点击拖拽可挪动图形内容。
Dash与Markdown
通过dash_html_components库可以显示HTML的内容,但是,直接写HTML语句非常枯燥。如需要写入大量的格式化文本,可使用dash_core_components库中Markdown组件。
# -*- coding: utf-8 -*-
import dash_core_components as dcc
import dash_html_components as html
import dash

app = dash.Dash()

Markdown_text = '''
#### 标题
# 1级标题 \#
## 2级标题 \##

#### 分割线
***

### 粗体斜体
*斜体*,文字两边各写一个\*星号

**粗体**,文字两边各写两个\*星号

1. [有提示的链接](http://url.com/ "有提示的链接")
2. [没有提示的链接](http://url.com/)

#### 表格 不支持
姓名|语文|数学|总成绩
---|:---|:---:|---:
张三|100|90|190

#### 引用文字
使用\>是一级引用,使用两个>,即>>,是引用里面的引用
>引用文字
>>引用里面的引用
'''

app.css.append_css(
    {"external_url": "https://codepen.io/chriddyp/pen/bWLwgP.css"})

app.layout = html.Div([
    dcc.Markdown(children=Markdown_text)
])

if __name__ == '__main__':
    app.run_server()
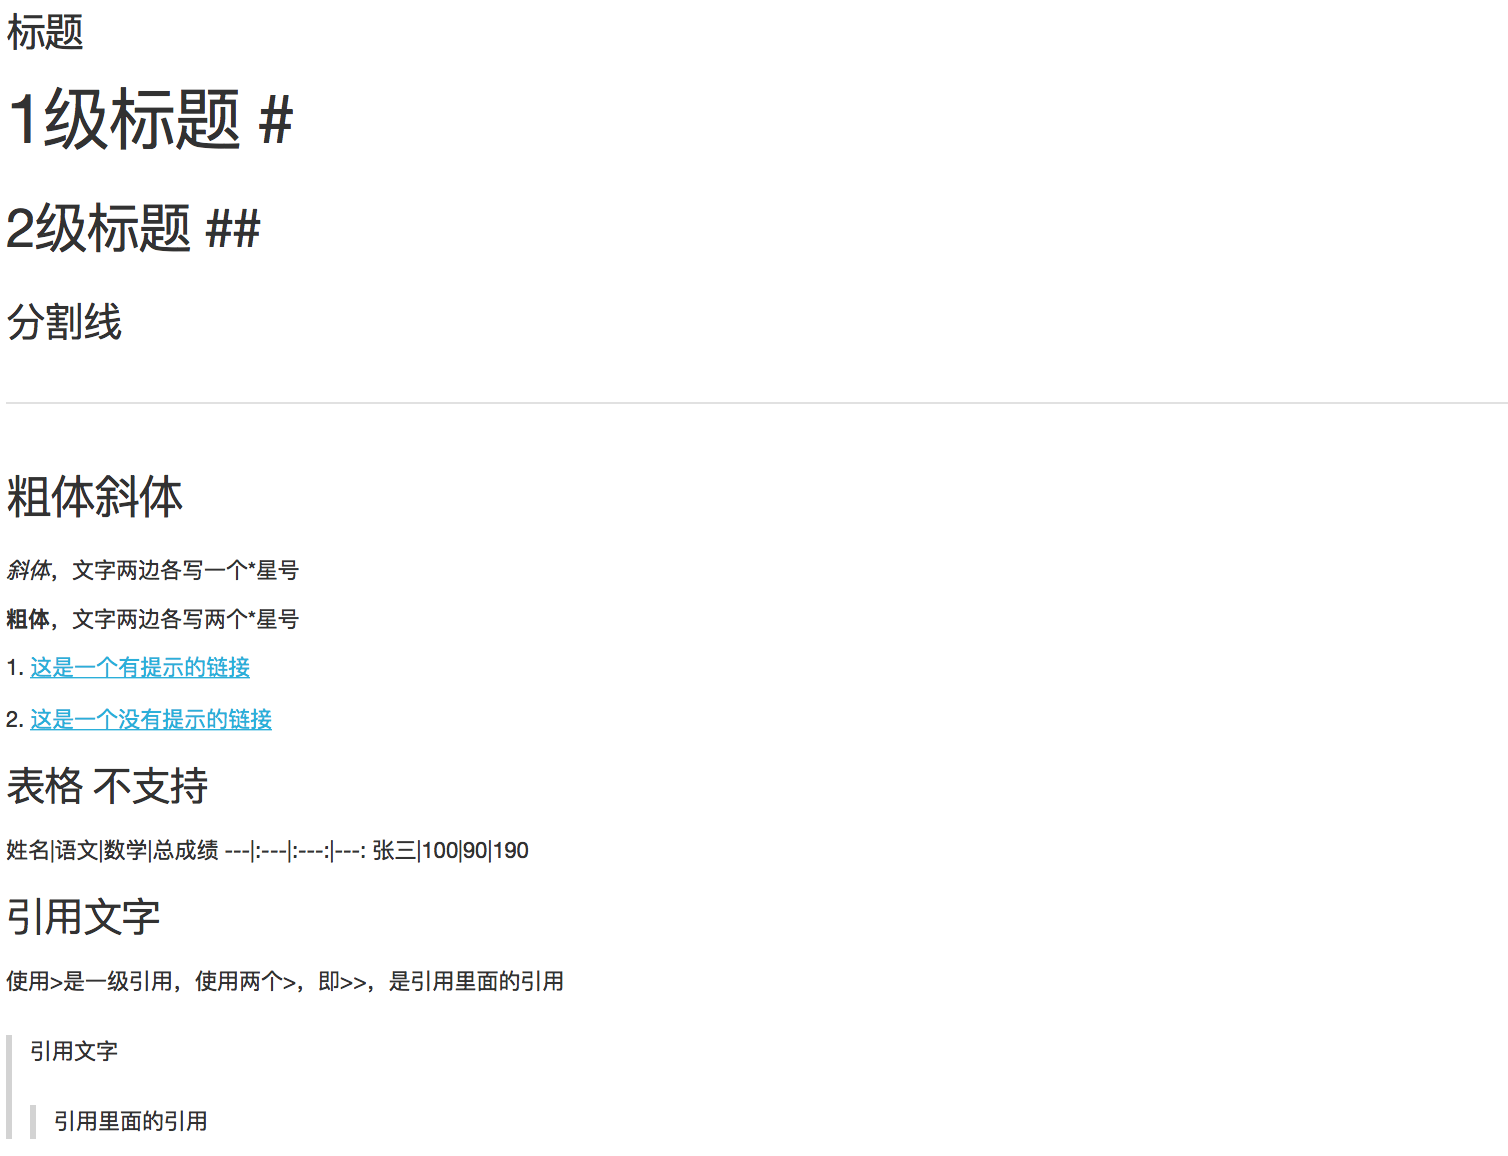
Dash支持Markdown,使用CommonMark作为Markdown规范。如果不了解Markdown,请查阅 60秒Markdown教程,或本文译者编写的5分钟玩转Markdown。
译注:经测试,不支持表格、[TOC]生成目录、代码块等
核心组件
dash_core_components库包含了一组高阶组件,包括下拉菜单、图形、Markdown等等。
和其它Dash组件一样,这些组件都是声明式的,组件的关键字参数也一样,每个选项都可以进行配置。
本教程将逐一介绍这些组件,在Dash核心组件示例库中也可以查看这些组件。
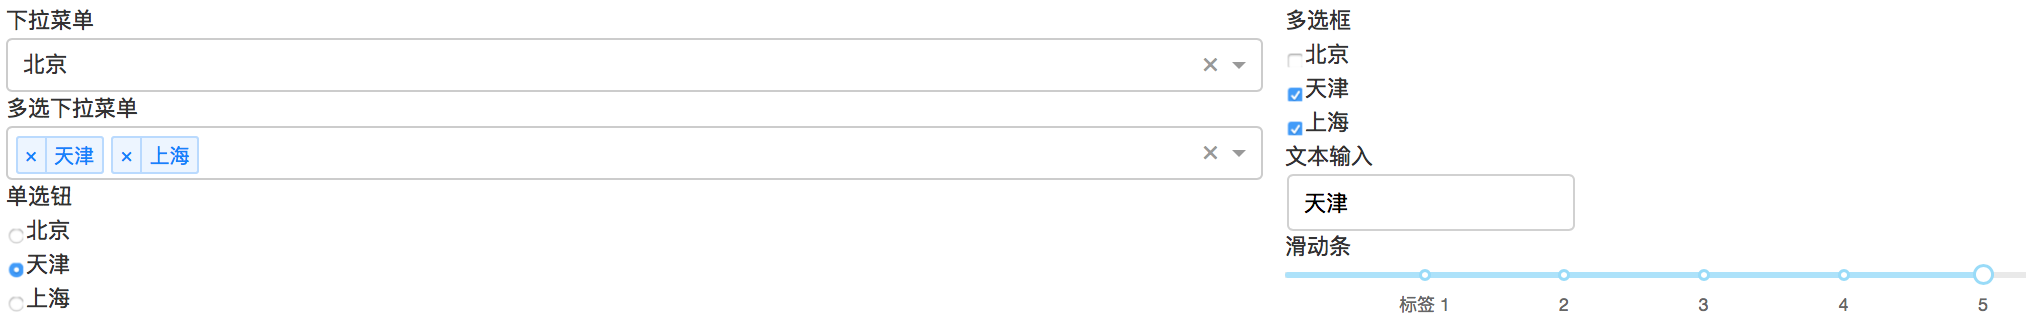
下面是一些常用的组件:
# -*- coding: utf-8 -*-
import dash
import dash_html_components as html
import dash_core_components as dcc

app = dash.Dash()

app.css.append_css(
    {"external_url": "https://codepen.io/chriddyp/pen/bWLwgP.css"})

app.layout = html.Div([
    html.Label('下拉菜单'),
    dcc.Dropdown(
        options=[
            {'label': '北京', 'value': '北京'},
            {'label': '天津', 'value': '天津'},
            {'label': '上海', 'value': '上海'}
        ],
        value='北京'
    ),

    html.Label('多选下拉菜单'),
    dcc.Dropdown(
        options=[
            {'label': '北京', 'value': '纽约'},
            {'label': '天津', 'value': '天津'},
            {'label': '上海', 'value': '上海'}
        ],
        value=['天津', '上海'],
        multi=True
    ),

    html.Label('单选钮'),
    dcc.RadioItems(
        options=[
            {'label': '北京', 'value': '纽约'},
            {'label': '天津', 'value': '天津'},
            {'label': '上海', 'value': '上海'}
        ],
        value='天津'
    ),

    html.Label('多选框'),
    dcc.Checklist(
        options=[
            {'label': '北京', 'value': '纽约'},
            {'label': '天津', 'value': '天津'},
            {'label': '上海', 'value': '上海'}
        ],
        values=['天津', '上海']
    ),

    html.Label('文本输入'),
    dcc.Input(value='天津', type='text'),

    html.Label('滑动条'),
    dcc.Slider(
        min=0,
        max=9,
        marks={i: '标签 {}'.format(i) if i == 1 else str(i)
               for i in range(1, 6)},
        value=5,
    ),
], style={'columnCount': 2})

if __name__ == '__main__':
    app.run_server(debug=True)
调用帮助help
Dash组件是声明式的:在实例化关键字参数时,可设置可配置项。可在Python控制台中调用帮助help ,查看组件及其参数的详细说明。
>>> help(dcc.Dropdown)
class Dropdown(dash.development.base_component.Component)
|  A Dropdown component.
|  Dropdown is an interactive dropdown element for selecting one or more
|  items.
|  The values and labels of the dropdown items are specified in the `options`
|  property and the selected item(s) are specified with the `value` property.
|
|  Use a dropdown when you have many options (more than 5) or when you are
|  constrained for space. Otherwise, you can use RadioItems or a Checklist,
|  which have the benefit of showing the users all of the items at once.
|
|  Keyword arguments:
|  - id (string; optional)
|  - className (string; optional)
|  - disabled (boolean; optional): If true, the option is disabled
|  - multi (boolean; optional): If true, the user can select multiple values
|  - options (list; optional)
|  - placeholder (string; optional): The grey, default text shown when no option is selected
|  - value (string | list; optional): The value of the input. If `multi` is false (the default)
|  then value is just a string that corresponds to the values
|  provided in the `options` property. If `multi` is true, then
|  multiple values can be selected at once, and `value` is an
|  array of items with values corresponding to those in the
|  `options` prop.```
总结
layout用于描述Dash应用的形态,是结构化的树状组件。dash_html_components 库为HTML标签和关键字参数提供了类,用于描述style 、className 与 id 等HTML属性 。dash_core_componets库生成控件和图形等高级组件。
详情可查阅:
下一节,介绍如何实现Dash应用交互。
【译Py】Python交互式数据分析报告框架~Dash介绍
【译Py】Dash用户指南01-02_安装与应用布局
【译Py】Dash用户指南03_交互性简介
【译Py】Dash用户指南04_交互式数据图
【译Py】Dash用户指南05_使用State进行回调