Android统计图表之柱状图(条形图)
柱状图是统计图表中经常用到的一种图表,比如降雨量之类的统计展示。我之前写了一些关于Android上的统计图表库MPAndroidChart,附录了一些我自己写的技术文档,在这些文档中介绍了MPAndroidChart的详细内容。
文章:
1,《Android统计图表MPAndroidChart》,http://blog.csdn.net/zhangphil/article/details/47656521
2,《基于Android MPAndroidChart实现腾讯QQ群数据统计报表核心功能》,http://blog.csdn.net/zhangphil/article/details/47685515
3,《Android实现天气预报温度/气温折线趋势图》,http://blog.csdn.net/zhangphil/article/details/47702245
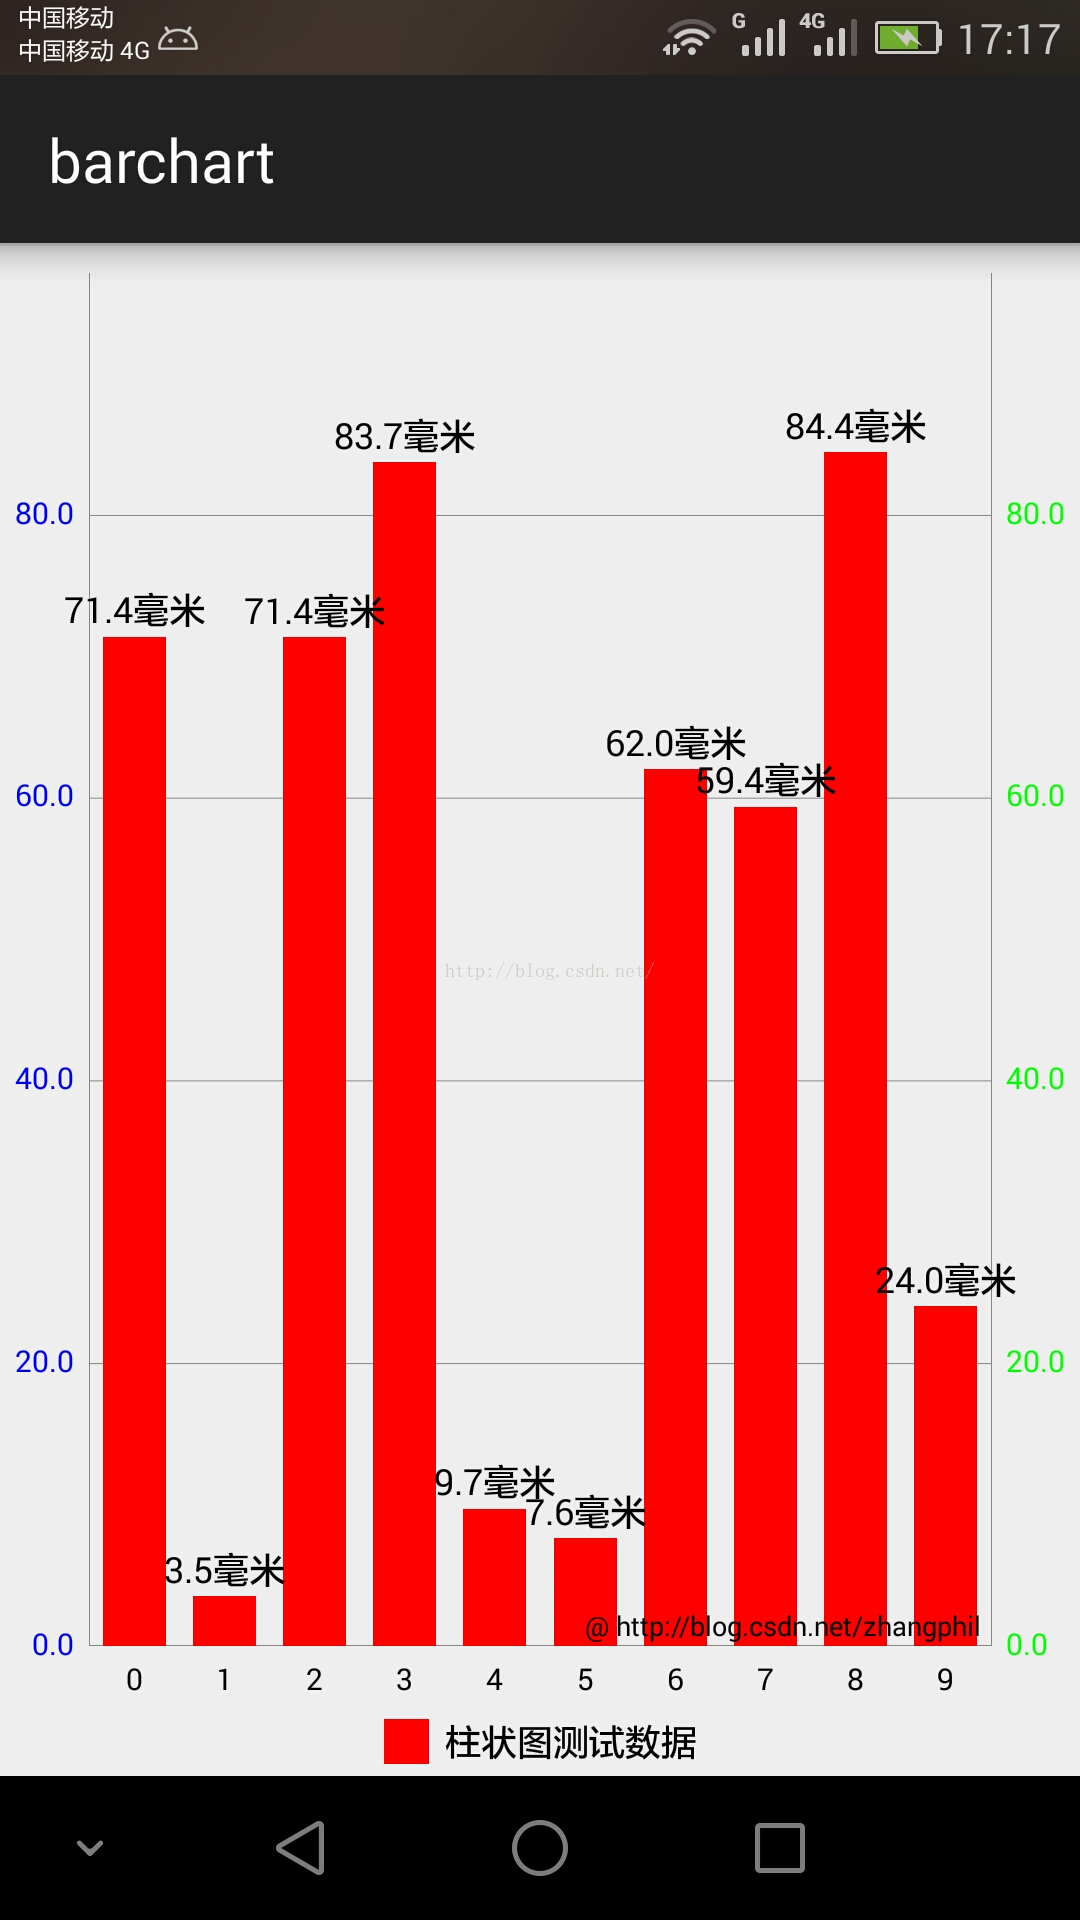
现在基于Android平台上的MPAndroidChart,在Android上实现柱状图,以降雨量为例,制作一个简单的降雨量柱状图(条形图)。
测试的主MainActivity.java
package zhangphil.barchart;

import java.text.DecimalFormat;
import java.util.ArrayList;

import com.github.mikephil.charting.charts.BarChart;
import com.github.mikephil.charting.components.Legend;
import com.github.mikephil.charting.components.XAxis;
import com.github.mikephil.charting.components.YAxis;
import com.github.mikephil.charting.components.Legend.LegendForm;
import com.github.mikephil.charting.components.Legend.LegendPosition;
import com.github.mikephil.charting.components.XAxis.XAxisPosition;
import com.github.mikephil.charting.components.YAxis.YAxisLabelPosition;
import com.github.mikephil.charting.data.BarData;
import com.github.mikephil.charting.data.BarDataSet;
import com.github.mikephil.charting.data.BarEntry;
import com.github.mikephil.charting.utils.ValueFormatter;

import android.support.v7.app.ActionBarActivity;
import android.graphics.Color;
import android.os.Bundle;

public class MainActivity extends ActionBarActivity {

	@Override
	protected void onCreate(Bundle savedInstanceState) {
		super.onCreate(savedInstanceState);
		setContentView(R.layout.activity_main);

		BarChart mBarChart = (BarChart) findViewById(R.id.bar_chart);

		setBarChartStyle(mBarChart);

		// 制作10个数据点。
		setData(mBarChart, 10);
	}

	private void setBarChartStyle(BarChart mBarChart) {

		mBarChart.setDrawBarShadow(false);
		mBarChart.setDrawValueAboveBar(true);
		mBarChart.setDescription("@ http://blog.csdn.net/zhangphil");
		mBarChart.setMaxVisibleValueCount(60);
		mBarChart.setPinchZoom(false);
		mBarChart.setDrawGridBackground(false);

		XAxis xAxis = mBarChart.getXAxis();
		xAxis.setPosition(XAxisPosition.BOTTOM);
		xAxis.setDrawGridLines(false);
		xAxis.setSpaceBetweenLabels(2);

		YAxis leftAxis = mBarChart.getAxisLeft();
		leftAxis.setLabelCount(5, false);
		leftAxis.setPosition(YAxisLabelPosition.OUTSIDE_CHART);
		leftAxis.setSpaceTop(15f);
		leftAxis.setTextColor(Color.BLUE);

		YAxis rightAxis = mBarChart.getAxisRight();
		rightAxis.setDrawGridLines(false);
		rightAxis.setLabelCount(5, false);
		rightAxis.setSpaceTop(15f);
		rightAxis.setTextColor(Color.GREEN);

		Legend mLegend = mBarChart.getLegend();
		mLegend.setPosition(LegendPosition.BELOW_CHART_CENTER);
		mLegend.setForm(LegendForm.SQUARE);
		mLegend.setFormSize(15f);
		mLegend.setTextSize(12f);
		mLegend.setXEntrySpace(5f);
	}

	private void setData(BarChart mBarChart, int count) {

		ArrayList<String> xVals = new ArrayList<String>();
		for (int i = 0; i < count; i++) {
			xVals.add(i, i + "");
		}

		ArrayList<BarEntry> yVals = new ArrayList<BarEntry>();

		for (int i = 0; i < count; i++) {
			float val = (float) (Math.random() * 100);
			yVals.add(new BarEntry(val, i));
		}

		BarDataSet mBarDataSet = new BarDataSet(yVals, "柱状图测试数据");

		// 如果是0f,那么柱状图之间将紧密无空隙的拼接在一起形成一片。
		mBarDataSet.setBarSpacePercent(30f);

		// 柱状图柱的颜色
		mBarDataSet.setColor(Color.RED);

		// 当柱状图某一柱被选中时候的颜色
		mBarDataSet.setHighLightColor(Color.YELLOW);

		mBarDataSet.setValueFormatter(new ValueFormatter() {

			@Override
			public String getFormattedValue(float value) {
				DecimalFormat decimalFormat = new DecimalFormat(".0");
				String s = decimalFormat.format(value) + "毫米";

				return s;
			}
		});

		ArrayList<BarDataSet> dataSets = new ArrayList<BarDataSet>();
		dataSets.add(mBarDataSet);

		BarData mBarData = new BarData(xVals, dataSets);
		mBarData.setValueTextSize(12f);

		mBarChart.setData(mBarData);
	}
}
MainActivity.java需要的布局文件activity_main.xml:
<RelativeLayout xmlns:android="http://schemas.android.com/apk/res/android"
    xmlns:tools="http://schemas.android.com/tools"
    android:layout_width="match_parent"
    android:layout_height="match_parent" >

   <com.github.mikephil.charting.charts.BarChart
        android:id="@+id/bar_chart"
        android:layout_width="match_parent"
        android:layout_height="match_parent"/>

</RelativeLayout>
运行结果如图: