最近项目在频繁的操作excel,里边涉及到很多和图表有关的东西。有时候需要使用java操作excel自带的图标,比较复杂的我们都是使用excel模板的形式实现。
除此之外,也有一些功能只需要生成对应的图标样式的图片就好,我们实现的时候主要用了两种方式,一种就是由前台生成图片base64码,然后后台解码生成图片插入到excel,但是这种方式有 一定的局限性,也就是当某些功能需要后台定时生成excel的时候,就无法获取这个图片。
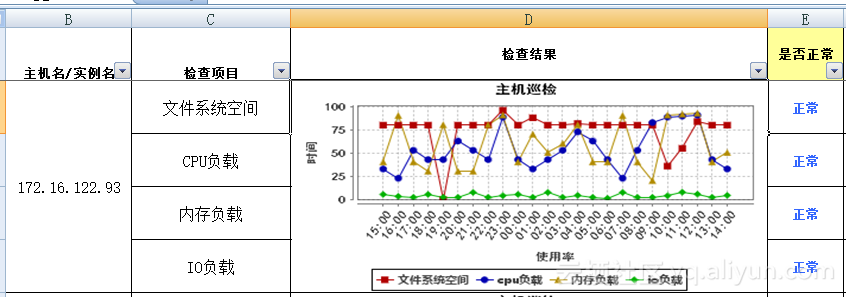
于是我们采用了另一种方法,也就是是用jfreechart生成对应的图片,然后结合poi插入到excel对应的位置,下图是项目中使用后的真实效果:
图1是前端base64码生成的:
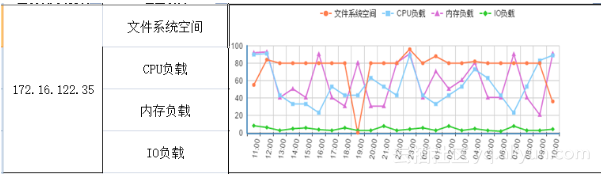
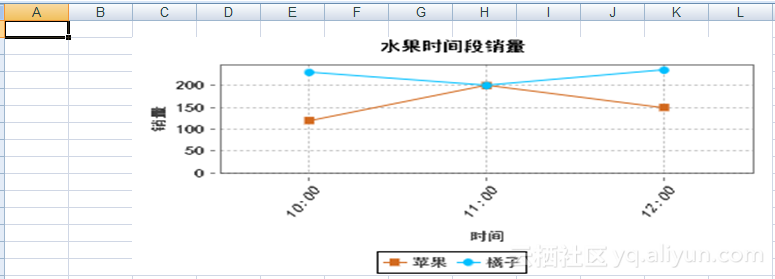
图2是后台jfreechart生成的:
以下是抽空做的一个简单的整理:
1、maven导包:
<dependency>
    	<groupId>org.apache.poi</groupId>
    	<artifactId>poi-ooxml</artifactId>
    	<version>3.8</version>
</dependency>
<dependency>
    	<groupId>org.apache.poi</groupId>
    	<artifactId>poi-scratchpad</artifactId>
    	<version>3.8</version>
</dependency>
<dependency>
    	<groupId>jfree</groupId>
    	<artifactId>jfreechart</artifactId>
    	<version>1.0.13</version>
</dependency>
2、java测试main方法代码:
package test;
import java.awt.BasicStroke;
import java.awt.Color;
import java.awt.Font;
import java.awt.image.BufferedImage;
import java.io.ByteArrayOutputStream;
import java.io.File;
import java.io.FileOutputStream;
import java.io.IOException;
import java.util.ArrayList;
import java.util.List;
import javax.imageio.ImageIO;
import org.apache.poi.hssf.usermodel.HSSFClientAnchor;
import org.apache.poi.hssf.usermodel.HSSFPatriarch;
import org.apache.poi.hssf.usermodel.HSSFSheet;
import org.apache.poi.hssf.usermodel.HSSFWorkbook;
import org.jfree.chart.ChartColor;
import org.jfree.chart.ChartFactory;
import org.jfree.chart.ChartUtilities;
import org.jfree.chart.JFreeChart;
import org.jfree.chart.axis.CategoryAxis;
import org.jfree.chart.axis.CategoryLabelPositions;
import org.jfree.chart.axis.NumberAxis;
import org.jfree.chart.axis.NumberTickUnit;
import org.jfree.chart.axis.ValueAxis;
import org.jfree.chart.plot.CategoryPlot;
import org.jfree.chart.plot.PlotOrientation;
import org.jfree.chart.renderer.category.LineAndShapeRenderer;
import org.jfree.chart.title.LegendTitle;
import org.jfree.chart.title.TextTitle;
import org.jfree.data.category.DefaultCategoryDataset;
import org.jfree.ui.RectangleEdge;

/**
 * 结合poi和jfreechart创建图表图片
 *
 * @author tuzongxun
 * @date 2016年9月19日 上午10:55:09
 */
public class ExcelDemo2 {
	public static void main(String[] args) throws Exception {
		// excel2003工作表
		HSSFWorkbook wb = new HSSFWorkbook();
		HSSFSheet sheet = wb.createSheet("Sheet 1");
		ByteArrayOutputStream byteArrayOut = new ByteArrayOutputStream();
		;
		// 设置具体数据
		List<String> timeList = new ArrayList<String>();
		timeList.add("10:00");
		timeList.add("11:00");
		timeList.add("12:00");
		List<Integer> appList = new ArrayList<Integer>();
		appList.add(120);
		appList.add(200);
		appList.add(150);
		List<Integer> oraList = new ArrayList<Integer>();
		oraList.add(230);
		oraList.add(200);
		oraList.add(235);
		// 设置图片中的字体和颜色以及字号
		Font titleFont = new Font("黑体", Font.BOLD, 12);
		Font xfont = new Font("黑体", Font.BOLD, 10);
		Font labelFont = new Font("黑体", Font.BOLD, 10);
		// 设置数据区域
		DefaultCategoryDataset dataset = new DefaultCategoryDataset();
		for (int i = 0; i < timeList.size(); i++) {
			String time = timeList.get(i);
			dataset.addValue(appList.get(i), "苹果", time);
			dataset.addValue(oraList.get(i), "橘子", time);
		}
		JFreeChart chart = ChartFactory.createLineChart("水果时间段销量", "时间", "销量", dataset, PlotOrientation.VERTICAL, true,
		    true, true);
		// 设置图例字体
		chart.getLegend().setItemFont(new Font("黑体", Font.BOLD, 10));
		// 设置标题字体
		chart.setTitle(new TextTitle(chart.getTitle().getText(), titleFont));
		// 图形的绘制结构对象
		CategoryPlot plot = chart.getCategoryPlot();
		// 获取显示线条的对象
		LineAndShapeRenderer lasp = (LineAndShapeRenderer) plot.getRenderer();
		// 设置拐点是否可见/是否显示拐点
		lasp.setBaseShapesVisible(true);
		// 设置拐点不同用不同的形状
		lasp.setDrawOutlines(true);
		// 设置线条是否被显示填充颜色
		lasp.setUseFillPaint(false);
		LineAndShapeRenderer renderer = (LineAndShapeRenderer) plot.getRenderer();
		// 设置折线大小以及折线的颜色
		renderer.setSeriesStroke(0, new BasicStroke(1.0F));
		renderer.setSeriesPaint(0, new Color(210, 105, 30));
		renderer.setSeriesStroke(1, new BasicStroke(1.0F));
		renderer.setSeriesPaint(1, new Color(0, 191, 255));
		// 设置折点的大小
		lasp.setSeriesOutlineStroke(0, new BasicStroke(0.025F));
		lasp.setSeriesOutlineStroke(1, new BasicStroke(0.05F));
		// 设置网格线
		plot.setDomainGridlinePaint(Color.gray);
		plot.setDomainGridlinesVisible(true);
		plot.setRangeGridlinePaint(Color.gray);
		plot.setRangeGridlinesVisible(true);
		// x轴
		CategoryAxis domainAxis = plot.getDomainAxis();
		// 设置x轴不显示,即让x轴和数据区重合
		domainAxis.setAxisLineVisible(false);
		// x轴标题
		domainAxis.setLabelFont(xfont);
		// x轴数据倾斜
		domainAxis.setCategoryLabelPositions(CategoryLabelPositions.createUpRotationLabelPositions(0.95D));
		// X轴坐标上数值字体
		domainAxis.setTickLabelFont(labelFont);
		// 设置Y轴间隔
		NumberAxis numAxis = (NumberAxis) plot.getRangeAxis();
		numAxis.setTickUnit(new NumberTickUnit(50));
		// y轴
		ValueAxis rangeAxis = plot.getRangeAxis();
		rangeAxis.setLabelFont(xfont);
		// 设置y轴不显示,即和数据区重合
		rangeAxis.setAxisLineVisible(false);
		// y轴坐标上数值字体
		rangeAxis.setTickLabelFont(labelFont);
		rangeAxis.setFixedDimension(0);
		CategoryPlot cp = chart.getCategoryPlot();
		// 背景色设置
		cp.setBackgroundPaint(ChartColor.WHITE);
		cp.setRangeGridlinePaint(ChartColor.GRAY);
		// 创建图例,设置图例的位置,这里的设置实际不起作用,怎么设都在下边
		LegendTitle legendTitle = new LegendTitle(chart.getPlot());
		legendTitle.setPosition(RectangleEdge.BOTTOM);
		try {
			ChartUtilities.writeChartAsPNG(byteArrayOut, chart, 400, 200);
			String fileSavePath = "exTest.png";
			BufferedImage bufferImg = ImageIO.read(new File(fileSavePath));
			ImageIO.write(bufferImg, "png", byteArrayOut);
		} catch (IOException e) {
		}
		// 画图的顶级管理器,一个sheet只能获取一个(一定要注意这点)
		HSSFPatriarch patriarch = sheet.createDrawingPatriarch();
		// 八个参数,前四个表示图片离起始单元格和结束单元格边缘的位置,
		// 后四个表示起始和结束单元格的位置,如下表示从第2列到第12列,从第1行到第15行,需要注意excel起始位置是0
		HSSFClientAnchor anchor = new HSSFClientAnchor(0, 0, 0, 0, (short) 2, (short) 1, (short) 12, (short) 15);
		anchor.setAnchorType(3);
		// 插入图片
		patriarch.createPicture(anchor, wb.addPicture(byteArrayOut.toByteArray(), HSSFWorkbook.PICTURE_TYPE_PNG));
		// excel2003后缀
		FileOutputStream fileOut = new FileOutputStream("exTest.xls");
		wb.write(fileOut);
		fileOut.close();
	}
}
结果如图: