SQL Server is an open-source relational database management system (RDBMS). Its primary function is to store and retrieve data when required by other applications. It runs on various operating systems, such as Linux, UNIX, and Windows and across a wide range of applications. Alibaba Cloud ApsaraDB for RDS fully supports SQL Server, provides automated monitoring, backup and disaster recovery capabilities.
The Impact of High CPU Usage in SQL Server
Despite its several functionality and advantages, SQL Server has its own set of concerns. A primary issue with SQL Server is its sensitivity to latency. This often results in performance issues. The reason for latency issue may vary depending on the workload to which the CPU is subjected.
Let us take a deep dive into seven possible causes of high CPU usage in SQL Server, including debugging app design. They are as follows:
- Missing indexes
- Index fragmentation
- Data type conversion
- Non-SARG query
- Parameter sniffing
- Statistics
- Top CPU-consuming queries
Missing Indexes
While troubleshooting, we discovered that the top contributor to high CPU usage is missing indexes. Let us first understand what indexes are. Index structure is the projection of one or more columns of data in the base table. It uses a particular structure sorted in ascending or descending order. It enables higher query efficiency, especially for frequently used queries.
The particular sorted structure of indexes makes searching efficient and allows you to find the desired data without consuming too much I/O. Consequently, reduced I/O consumption leads to minimized CPU usage. Now, let us look at the methods for finding missing indexes.

Methods for Finding Missing Indexes
How can we find out the missing indexes in the respective tables?
The first method is by using Database Tuning Advisor (DTA). The second method is through issuing warnings for missing indexes in the execution plan. During a statement execution, the execution plan issues a warning that an index is missing. With such a warning, you can locate the missing index and create it. The third method is to access the system's dynamic view. There are typically three views: sys.dm_db_missing_index_group_stats, sys.dm_db_missing_index_group_stats and sys.dm_db_missing_index_details. For specific use, please refer to our help documentation.
Blindly Creating Missing Indexes
The creation of the missing indexes should not proceed blindly. You need to ensure that the index created is valid. Since the index data structure also occupies data file space, index creation may lead to storage overhead. Also, DML operations will result in increased index maintenance costs as the index structure is a combination of one or more columns of data in the table. The consistency of the data structure will transform with the data change in the base table. When we perform delete, insert and update operations, we also need to perform maintenance on the index data structure. This is done to ensure consistency between indexed data and base table data, hence the rising index maintenance cost.
Index Fragmentation
Since missing indexes lead to rising CPU usage, another question may arise, will the CPU usage decline after creating the missing index? Or will the CPU usage not rise when none of the indexes are missing? The answer to both these questions is no. In this section, we will cover index fragmentation.
Index fragmentation refers to gaps in index data pages. To be specific, if a page is full, for example, it occupies a space of 8 KB, and 25% of it is blank data, the real effective data is only 75%. For example, if the index data of a table has 100 pages, and the fragmentation rate is 25%, only 75 pages of data among the total 100 pages is valid. When index fragmentation rate is very high, the index efficiency will be very low as its I/O usage will also be very low.

Rebuilding Indexes
The solution to index fragmentation is simple. We need to execute an index rebuilding operation. Statistics will update after index rebuilding, and the cache information in the corresponding execution plan will clear. When the same statement reappears, SQL Server will re-evaluate and select a better execution plan.
Precautions When Rebuilding Indexes
Index rebuilding can easily solve index fragmentation. However, there are a few precautions worth keeping in mind. Since index rebuilding will lead to increased data log files, SQL Server log file-based technologies such as Database Mirroring, Log Shipping, and AlwaysOn will slow down the process due to surging log files within a short period.
How to Rebuild Indexes?
You must follow an "unless 100% necessary" principle for building indexes. For tables that you do not use very often, don’t follow such a criteria, even if their fragmentation rates are very high, such as some small tables or heap tables. For small tables, SQL Server chooses Table Scan instead of Index Seek or Index Scan during execution planning.
The second principle when rebuilding indexes is to ensure you check the index fragmentation rates at every index level instead of rebuilding indexes for the entire table blindly. The third principle is to choose tiered measures for processing index fragmentation rates at different levels. If the fragmentation rate is below 10%, there is no need to rebuild indexes. If the index fragmentation rate is 10% to 30%, we recommend a reorganize operation. Further, when the index fragmentation rate is greater than 30%, you can rebuild the indexes. If you are using the enterprise edition, select the ONLINE = ON option to minimize the impact of index rebuilding on apps.
Also, note that index rebuilding is an I/O-intensive and I/O-consuming operation. Therefore, you should rebuild your indexes during non-peak business hours.
Now, let us see how we can minimize the impact of index rebuilding when Database Mirroring, Log Shipping, or AlwaysOn are in use. For this, we need to use table partition technology. You can create a table partition on a large table, and rebuild indexes for partitions one by one. Since each partition splits data, it the resulting data size. Hence, the impact of the operation on I/O resources is less noticeable.
Implicit Conversion of Data Types
Moving on to the next possible cause, let us discuss the implicit conversion of data types. First, let us understand what it means.

What Is Implicit Conversion of Data Types?
During data type comparison, SQL Server must make sure that data types at both ends of the comparison operator are consistent. These include equal to, on clauses, greater than or equal to, and less than or equal to, to enable the comparison.
If data types are inconsistent, SQL Server will automatically convert the data type implicitly. The implicit conversion is invisible and probably imperceptible to users. However, the database system makes a lot of implicit conversion in the background. Such conversion processing is performance-consuming, leading to high CPU usage.
Data Type Conversion Principles
The rules for data type conversion in SQL Server are simple. Data type conversion happens from low priority to high priority. For example, the int data type is of higher priority than the char data type. When comparing these two data types, the conversion of char data to int prior for comparison will take place.
Precautions to Take during Data Type Conversion
Let us look at a few precautions you must take for this conversion. Please note that once an SQL Server has implicitly converted data types and the implicit conversion has taken place on top of the base table of the formal table, you will not be able to use Index Seek. However, you will have to use Index Scan instead, which has poor performance. This will lead to an increase in SQL Server I/O usage and consequently increase CPU usage.
How Can You Avoid Implicit Conversion of Data Types?
To avoid the implicit conversion of data types, the first method is to review the data type design of your tables. In anti-paradigm theory, there is an anti-paradigm design to avoid multi-table joins when the same field expresses the same meaning, and the same field is stored in multiple tables. In this case, make sure that data types of these fields are consistent so that SQL Server does not perform implicit data type conversion in the background. This may happen for subsequent queries or execution of on clauses for joins.
The second method is to make sure that when a where statement uses "Where column = constant" or similar incoming parameters, the data type of the incoming parameter and that of the field in the base table are consistent. The objective, in this case, is to avoid triggering implicit data type conversion. Further, a frequent problem faced by users is that the incoming data type has a higher priority than the base table field data. In this case, SQL Server needs to convert the data type of the base table field in the background automatically. If the base table contains 100 million data records, SQL Server must convert the column data type of the 100 million data records and compare them. This will have I/O consumption soaring, which further increases CPU usage.
The third method is to check the execution plan. A CONVERT_IMPLICT keyword in the execution plan can help identify whether the system has performed XML implicit data type conversion. Furthermore, the fourth method is to search the cache of the execution plan to get the cached XML file that contains the keyword for implicit data type conversion.
Non-SARG Query

First, we look into the meaning of Non-SARG. Non-SARG is derived from a contraction of Search ARGument ABLE, found in relational databases like RDBMS. It is a condition (or predicate) in a query which occurs when the DBMS engine can take advantage of an index to speed up the execution of the query.
A query that fails to be sargable is known as a non-sargable query. It has an adverse effect on query time.
In case indexes have been created on some columns in the base table, SQL Server's query optimizer must still scan all rows, resulting in non-SARG queries.
Process under Normal Circumstances
The above explanation may be applicable more in theory. However, under normal circumstances, functions used in base table fields in the where statement are Convert, Cast, and implicit conversion of data types. Functions included for time operations consist of Datediff for estimating the time difference, Dateadd for adding or subtracting time values and Year for getting the year value. They also use Upper and Lower-case conversion functions, Rtrim, Substring and Left for string operations, and like fully fuzzy matching, Isnull function, and user-defined functions. When you write SQL where or other statements for functional operations on the base table, please note that if there is a non-SARG query within the operation, CPU usage will increase.
Parameter Sniffing

Understanding Parameter Sniffing in SQL Server
Parameter sniffing is a consequence of SQL Server's compilation and caching processes on the execution plan. To understand this, you must first understand how an SQL Server executes a query statement. When the SQL Server receives an SQL statement, it first checks the syntax and then performs a semantic analysis. Next, it compiles the statement, selects the optimal execution plan path, and caches the result into the execution plan path.
The Problem with Parameter Sniffing
The problem here lies in the compiling of these query statements. Some query statements carry parameters. During compilation, the optimal execution plan must be determined based on the incoming parameter values at the time of compilation. However, as time proceeds, data may change, resulting in statistics changing or even data skewing. If such a situation occurs, the previously cached execution plan may no longer be optimal as the previously passed parameter values have altered. Also, the corresponding statistical information may not suggest the best solution. This is one reason for parameter sniffing to occur.
The Solution to Parameter Sniffing
Now that we know the cause of parameter sniffing, namely the compilation and caching processes of the execution plan, let's discuss the solution to this problem. A simple solution is to clear the cache since the previously cached execution plan is not optimal. Discussed below are several methods. However, we do not recommend some of these methods.
1.The first method is to restart the entire operating system. Once you restart the operating system, the memory clears as well as the cached execution plan. After SQL Server starts up, submit a query statement to the SQL Server. The system will compile and use the latest execution plan, which may solve the parameter sniffing problem. However, a disadvantage is that this approach can be overkill, like using a steam engine to crack a nut. Although the idea is correct, the method is not appropriate. Therefore, this is not a recommended method.
2.The second method is to restart the SQL Server service. This can also solve the problem. However, it will take the SQL Server down and render it unavailable for a short period. This method is slightly better than the first one but is still not recommended.
3.The third method is to use the DBCC FREEPROCCACHE command to clear the execution plan cache. While this method is better than the second one, it is also a bit excessive. The real problem lies in the cache of just one or a few execution plans. You can certainly solve the problem by clearing all the execution plans. However, this may also sacrifice a lot of normally-functioning execution plans. Hence, this is not the ideal solution.
4.The best solution is to clear a particular execution plan cache for a specific query or stored procedure.
5.Another solution is to use the Query Hits Option, which will command the SQL Server to recompile execution plan during execution of every stored procedure or query statement without caching the execution plan. This is also a feasible approach.
6.Another idea is to update statistics. The logic behind this method is that the basic execution plan compilation and optimal route selection data is the statistical information. Thus, when we update statistics, the execution plan cache of the corresponding query statement will also clear. During the next execution, a new execution plan will generate based on the latest statistics.
7.The last method, mentioned in one of the steps above, entails creating missing indexes or deleting unnecessary, redundant and duplicate indexes.
Statistics

What is Statistics in SQL Server?
Statistics are the unsung hero for many users. So what is statistics after all? Statistics provide the data foundation for the SQL Server optimizer. It means that the SQL Server estimates and selects optimal routes based on statistical values.
How to Create Statistics?
One way to create statistics is through manual generation. The other approach is an automatic creation by the system. There is an option in the database that allows the database to create statistics automatically. The third approach is to let the system automatically create statistics when creating indexes.
How do You Update Statistics?
The initial approach for updating statistics is to use Update Statistics. The next approach is to use the system sys.sp_updatestats stored procedure. Now, the third approach is to get the last time the statistics were updated through Stats_date.
Top CPU-consuming Queries

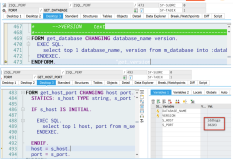
This section focuses on Top SQL. We have discussed the theoretical basis and demo of RDS SQL Server high CPU usage in the previous sections. This has given rise to certain questions, namely: How can we know the CPU usage of specific statements? How can we sort the statements by CPU usage in reverse order? The answer to this question is Top SQL. You can sort these statements by CPU usage in reverse order, or conveniently locate the top 10 most CPU-consuming queries, for example. Then how can we implement this sorting? The answer lies in the code captured in the screenshot above.
However, minor issues may occur. One issue is how we can find out the ranking of a specific query statement regarding total CPU usage in reverse order? For example, a query statement is executed 1,000 times. Then the total CPU usage of the 1,000 queries serves as a dimension. The total Top SQL for this query statement at each query is the second dimension. In perspective of the business as a whole, I/O reads and writes share the same logic. The logic is that it is possible to sort top I/O reads, top I/O writes and top durations in a method to locate the corresponding Top SQL.
Given the whole process, the above section covers all scenarios in which SQL Server will experience high CPU usage.
Conclusion
When you face a challenge regarding high CPU usage on an SQL server machine, it is essential to determine the possible component or function that may be the cause for it. You must first if the challenge is due to the SQL server or some other component. Since SQL Server is sensitive to latency, higher CPU latency might result in performance issues. Hence, it is essential to bring down the CPU usage to the extent possible by looking into the component that is causing this challenge. This article highlights seven possible causes of high CPU usage and their probable remedies.
Visit ApsaraDB for RDS to learn how Alibaba Cloud can help you with your SQL Server implementation.