一. 官网说明
Memory Architecture
http://download.oracle.com/docs/cd/B28359_01/server.111/b28318/memory.htm#i10221
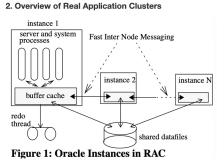
The database buffer cache is the portion of the SGA that holds copies of data blocks read from datafiles. All users concurrently connected to the instance share access to the database buffer cache.
This section includes the following topics:
(1)Organization of the Database Buffer Cache
The buffers in the cache are organized in two lists: the write list and the least recently used (LRU) list. The write list holds dirty buffers, which contain data that has been modified but has not yet been written to disk. The LRU list holds free buffers, pinned buffers, and dirty buffers that have not yet been moved to the write list. Free buffers do not contain any useful data and are available for use. Pinned buffers are currently being accessed.
When an Oracle Database process accesses a buffer, the process moves the buffer to the most recently used (MRU) end of the LRU list. As more buffers are continually moved to the MRU end of the LRU list, dirty buffers age toward the LRU end of the LRU list
The first time an Oracle Database user process requires a particular piece of data, it searches for the data in the database buffer cache.If the process finds the data already in the cache (a cache hit), it can read the data directly from memory. If the process cannot find the data in the cache (a cache miss), it must copy the data block from a datafile on disk into a buffer in the cache before accessing the data. Accessing data through a cache hit is faster than data access through a cache miss.
Before reading a data block into the cache, the process must first find a free buffer. The process searches the LRU list, starting at the least recently used end of the list. The process searches either until it finds a free buffer or until it has searched the threshold limit of buffers.
If the user process finds a dirty buffer as it searches the LRU list, it moves that buffer to the write list and continues to search. When the process finds a free buffer, it reads the data block from disk into the buffer and moves the buffer to the MRU end of the LRU list.
If an Oracle Database user process searches the threshold limit of buffers without finding a free buffer, the process stops searching the LRU list and signals the DBW0 background process to write some of the dirty buffers to disk.
(2)The LRU Algorithm and Full Table Scans
When the user process is performing a full table scan, it reads the blocks of the table into buffers and puts them on the LRU end (instead of the MRU end) of the LRU list. This is because a fully scanned table usually is needed only briefly, so the blocks should be moved out quickly to leave more frequently used blocks in the cache.
You can control this default behavior of blocks involved in table scans on a table-by-table basis. To specify that blocks of the table are to be placed at the MRU end of the list during a full table scan, use the CACHE clause when creating or altering a table or cluster. You can specify this behavior for small lookup tables or large static historical tables to avoid I/O on subsequent accesses of the table.
二. Buffer Cache 说明
Oracle 内存 架构 详解
http://blog.csdn.net/tianlesoftware/archive/2010/05/15/5594080.aspx
Oracle Shared pool 详解
http://blog.csdn.net/tianlesoftware/archive/2011/06/22/6560956.aspx
根据如下blog,整理了一下:
http://blog.csdn.net/robinson1988/archive/2010/11/02/5982996.aspx
http://www.adp-gmbh.ch/ora/misc/dynamic_performance_views.html#bh
buffer cache is to minimize physical io. When a block is read by Oracle, it places this block into the buffer cache, because there is a chance that this block is needed again. Reading a block from the buffer cache is less costly (in terms of time) than reading it from the disk.
2.1 MRU and LRU blocks
Blocks within the buffer cache are ordered from MRU (most recently used) blocks to LRU (least recently used) blocks. Whenever a block is accessed, the block goes to the MRU end of the list, thereby shifting the other blocks down towards the LRU end. When a block is read from disk and when there is no buffer available in the db buffer cache, one block in the buffer cache has to "leave". It will be the block on the LRU end in the list.
However, blocks read during a full table (multi block reads are placed on the LRU side of the list instead of on the MRU side.
The v$bh dynamic view has an entry for each block in the buffer cache. The time a block has been touched most recently is recorded in tim of x$bh
2.2 Touch count
Each buffer has an associated touch count. This touch count might be increased if a buffer is accessed (although it needs not always be).It is valid to claim that the higher the touch count, the more important (more used) the buffer. Therefore, buffers with a high touch count should stay in the buffer cache while buffers with a low touch count should age out in order to make room for other buffers.
A touch time can only be increased once within a time period controlled by the parameter _db_aging_touch_time (default: 3 seconds).
The touch count is recorded in the tch column of x$bh.
By the way, it looks like Oracle doesn't protect manipulations of the touch count in a buffer with a latch. This is interesting because all other manipulations on the LRU list are protected by latches. A side effect of the lack of latch-protection is that the touch count is not incremented if another process updates the buffer header.
2.3 x$bh
Information on buffer headers. Contains a record (the buffer header) for each block in the buffer cache.
This select statement lists how many blocks are Available, Free and Being Used.
|
1
2
3
4
5
6
7
8
9
10
11
12
13
14
15
16
17
18
19
20
21
22
23
24
25
26
27
28
29
30
31
32
33
34
35
36
37
38
39
40
41
42
43
44
45
46
47
48
49
50
51
52
53
54
55
56
57
58
59
60
61
|
* Formatted
on
2011
/
6
/
28
14
:
34
:
08
(QP5 v5
.163.1008.
3004
) */
SELECT COUNT (*), State
FROM (SELECT DECODE (state,
0
,
'Free'
,
1
, DECODE (lrba_seq,
0
,
'Available'
,
'Being Used'
),
3
,
'Being Used'
,
state)
State
FROM x$bh)
GROUP BY state
案例:
Elapsed:
00
:
00
:
00.01
17
:
13
:
39
SCOTT@ prod>conn scott/tiger
Connected.
17
:
13
:
45
SCOTT@ prod>select *
from
scott.emp;
EMPNO ENAME JOB MGR HIREDATE SAL COMM DEPTNO
---------- ---------- --------- ---------- --------- ---------- ---------- ----------
7369
SMITH CLERK
7902
17
-DEC
-80
800
20
7499
ALLEN SALESMAN
7698
20
-FEB
-81
1600
300
30
7521
WARD SALESMAN
7698
22
-FEB
-81
1250
500
30
7566
JONES MANAGER
7839
02
-APR
-81
2975
20
7654
MARTIN SALESMAN
7698
28
-SEP
-81
1250
1400
30
7698
BLAKE MANAGER
7839
01
-MAY
-81
2850
30
7782
CLARK MANAGER
7839
09
-JUN
-81
2450
10
7788
SCOTT ANALYST
7566
19
-APR
-87
3000
20
7839
KING PRESIDENT
17
-NOV
-81
5000
10
7844
TURNER SALESMAN
7698
08
-SEP
-81
1500
0
30
7876
ADAMS CLERK
7788
23
-MAY
-87
1100
20
7900
JAMES CLERK
7698
03
-DEC
-81
950
30
7902
FORD ANALYST
7566
03
-DEC
-81
3000
20
7934
MILLER CLERK
7782
23
-JAN
-82
1300
10
14
rows selected.
Elapsed:
00
:
00
:
00.06
17
:
14
:
41
SYS@ prod>select file#,block#,status,DIRTY,OBJD
from
v$bh
where
file#=
4
;
FILE# BLOCK# STATUS D OBJD
---------- ---------- ---------- - ----------
4
147
xcur N
74761
4
150
xcur N
74761
4
148
xcur N
74761
4
151
xcur N
74761
4
146
cr N
74761
4
146
xcur N
74761
4
149
xcur N
74761
7
rows selected.
Elapsed:
00
:
00
:
00.04
17
:
14
:
51
SYS@ prod>col object_name
for
a20
17
:
15
:
30
SYS@ prod>select object_name ,object_type
from
dba_objects
17
:
15
:
46
2
where
object_id=
74761
;
OBJECT_NAME OBJECT_TYPE
-------------------- -------------------
EMP TABLE
Elapsed:
00
:
00
:
00.05
|
有关x$bh 的几个字段说明
(1)state:
| 0 |
FREE |
no valid block image |
| 1 |
XCUR |
a current mode block, exclusive to this instance |
| 2 |
SCUR |
a current mode block, shared with other instances |
| 3 |
CR |
a consistent read (stale) block image |
| 4 |
READ |
buffer is reserved for a block being read from disk |
| 5 |
MREC |
a block in media recovery mode |
| 6 |
IREC |
a block in instance (crash) recovery mode |
(2)tch:
tch is the touch count. A high touch count indicates that the buffer is used often. Therefore, it will probably be at the head of the MRU list.
(3)tim: touch time.
(4)class: represents a value designated for the use of the block.
(5)lru_flag
(6)set_ds : maps to addr on x$kcbwds.
(7)le_addr: can be outer joined on x$le.le_addr.
(8)flag :is a bit array.
| Bit |
if set |
|
| 0 |
Block is dirty |
|
| 4 |
temporary block |
|
| 9 or 10 |
ping |
|
| 14 |
stale |
|
| 16 |
direct |
|
| 524288 (=0x80000) |
Block was read in a full table scan |
See this link |
2.4 Different pools within the cache
The cache consists actually of three buffer pools for different purposes.
2.4.1 Keep pool
The keep pool's purpose is to take small objects that should always be cached, for example Look Up Tables. See db_keep_cache_size.
2.4.2 Recycle pool
The recycle pool is for larger objects. See db_recycle_cache_size.
2.4.3 Default pool
The default pool is for everything else. See also x$kcbwbpd
2.4.4 x$kcbwbpd
Buffer pool descriptor, the base table for v$buffer_pool.
How is the buffer cache split between the default, the recycle and the keep buffer pool.
2.5 Cold and hot area
Each pool's LRU is divided into a hot area and a cold area. Accordingly, buffers with in the hot area are hot buffers (and buffers in the cold are are called cold buffers).
By default, 50% of the buffers belong to the cold area and the other 50% belong to the hot area. This behaviour can be changed with_db_percent_hot_default (for the default pool) _db_percent_hot_recycle (for the recycle pool) and _db_percent_hot_keep (for the keep pool).
A newly read db block will be inserted between the cold and the hot area such that it belongs to the hot area. This is called midpoint insertion. However, this is only true for single block reads, multi block reads will be placed at the LRU end.
2.6 Flushing the cache
With Oracle 10g it is possible to flush the buffer cache with:
10g:
SQL>alter system flush buffer_cache;
9i had an undocumented command to flush the buffer cache:
SQL>alter session set events = 'immediate trace name flush_cache';
2.7 Optimal Size
Some common wisdom says that the larger the buffer cache is, the better the performance of the database becomes. However, this claim is not always true.
To begin with, the cache needs to be managed. The bigger the cache, the larger the LRU and dirty list becomes. That results in longer search times for a free buffer (buffer busy waits).
Also, the bigger the cache, the greater the burden on the DBWn process.
--DB Cache 不是越大越好,如果DB Cache 过大,会造成大的LRU 列表和 dirty list。 这会会增加list的扫描时间。 同时大的cache 也会增加DBWn 进程的负担
2.8 Buffer Cache 中的管理结构
Buffer Cache是SGA的一部分,Oracle利用Buffer Cache来管理data block,Buffer Cache的最终目的就是尽可能的减少磁盘I/O。
Buffer Cache中主要有3大结构用来管理Buffer Cache:
(1)Hash Bucket 和 Hash Chain List :Hash Bucket与Hash Chain List用来实现data block的快速定位。
(2)LRU List :挂载有指向具体的free buffer, pinned buffer以及还没有被移动到 write list的dirty buffer 等信息。所谓的free buffer就是指没有包含任何数据的buffer,所谓的pinned buffer,就是指当前正在被访问的buffer。
(3)Write(Dirty)List :挂载有指向具体的 dirty block的信息。所谓的dirty block,就是指在 buffer cache中被修改过但是还没有被写入到磁盘的block。
2.8.1 Hash Bucket 和 Hash Chain List
Oracle将buffer cache中所有的buffer通过一个内部的Hash算法运算之后,将这些buffer放到不同的 Hash Bucket中。每一个Hash Bucket中都有一个Hash Chain List,通过这个list,将这个Bucket中的block串联起来。
要查看Hash Chain List组成, 可以通过x$bh字典.
|
1
2
3
4
5
6
7
8
9
10
11
12
13
|
SQL> desc x$bh
Name Null? Type
----------------------- - ----------------
ADDR RAW(
8
) ---block在buffer cache中的address
...
HLADDR RAW(
8
) --latch:cache buffers chains 的address
...
NXT_HASH RAW(
8
) ---指向同一个Hash Chain List的下一个block
PRV_HASH RAW(
8
) ---指向同一个Hash Chain List的上一个block
NXT_REPL RAW(
8
)---指向LRU list中的下一个block
PRV_REPL RAW(
8
)---指向LRU list中的上一个block
.....
|
Hash Chain List就是由x$bh中的NXT_HASH,PRV_HASH 这2个指针构成了一个双向链表,其示意图如下:
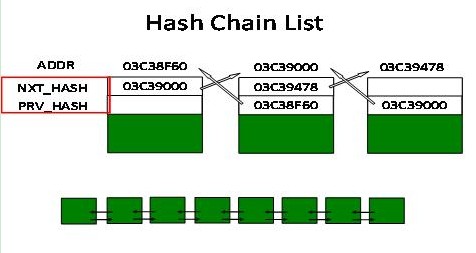
通过NXT_HASH,PRV_HASH这2个指针,那么在同一个Hash Chain List的block就串联起来了。
理解了Hash Bucket 和 Hash Chain List,我们现在来看看Hash Bucket 与 Hash Chain List管理Buffer Cache 的结构示意图
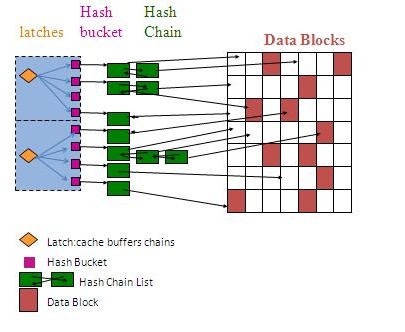
这个图和Shared Pool 有点类似。从图中我们可以看到,一个latch:cache buffers chains(x$bh.hladdr) 可以保护多个Hash Bucket,也就是说,如果我要访问某个block,我首先要获得这个latch,一个Hash Bucket对应一个Hash Chain List,而这个Hash Chain List挂载了一个或者多个Buffer Header。
Hash Bucket的数量受隐含参数_db_block_hash_buckets的影响;
Latch:cache buffers chains的数量受隐含参数_db_block_hash_latches的影响
该隐含参数可以通过如下查询查看:
|
1
2
3
4
5
6
7
8
9
10
11
12
|
SYS@node2(rac2)> select *
from
v$version
where
rownum=
1
;
BANNER
----------------------------------------------------------------
Oracle Database 10g Enterprise Edition Release
10.2.
0.4.
0
- Prod
SYS@anqing2(rac2)> SELECT x.ksppinm NAME, y.ksppstvl VALUE, x.ksppdesc describ
2
FROM x$ksppi x, x$ksppcv y
3
WHERE x.inst_id = USERENV (
'Instance'
)
4
AND y.inst_id = USERENV (
'Instance'
)
5
AND x.indx = y.indx
6
AND x.ksppinm LIKE
'%_db_block_hash%'
7
/
|
NAME VALUE DESCRIB
------------------------- ---------- -------------------------------------------
_db_block_hash_buckets 65536 Number of database block hash buckets
_db_block_hash_latches 2048 Number of database block hash latches
_db_block_hash_buckets 该隐含参数在8i以前等于db_block_buffers/4的下一个素数,到了8i 该参数等于 db_block_buffers*2 ,到了9i 以后,该参数取的是小于且最接近 db_block_buffers*2 的一个素数。
_db_block_hash_latches 该隐含参数表示的是 cache buffers chains latch的数量。
可以用下面查询cache buffers chains latch的数量:
|
1
2
3
4
|
SYS@node2(rac2)> select count(*)
from
v$latch_children a,v$latchname b
where
a.latch#=b.latch#
and
b.name=
'cache buffers chains'
;
COUNT(*)
----------
2048
|
也可以用下面查询cache buffers chains latch的数量
|
1
2
3
4
5
|
SYS@node2(rac2)> select count(distinct hladdr)
from
x$bh ;
COUNT(DISTINCTHLADDR)
---------------------
2048
|
根据之前查询的结果:
_db_block_hash_buckets(65536)/_db_block_hash_latches (2048) = 32
一个cache buffers chains latch 平均下来要管理32个Hash Bucket,现在找一个latch,来验证一下前面提到的结构图。
|
1
2
3
4
5
6
7
8
9
|
SYS@node2(rac2)> select *
from
(select hladdr,count(*)
from
x$bh group by hladdr)
where
rownum<=
5
;
HLADDR COUNT(*)
-------- ----------
2F619B90
9
2F619D0C
12
2F619E88
4
2F61A004
8
2F61A180
4
|
我们查询latch address 为2F619B90 所保护的data block
|
1
2
3
4
5
6
7
8
9
10
11
12
13
|
SYS@node2(rac2)> select hladdr,obj,dbarfil,dbablk, nxt_hash,prv_hash
from
x$bh
where
hladdr=
'2F619B90'
order by obj;
HLADDR OBJ DBARFIL DBABLK NXT_HASH PRV_HASH
-------- ---------- ---------- ---------- -------- --------
2F619B90
18
1
38576
2F619C84 22BD92F4
2F619B90
122
1
51823
2F619CCC 2F619CCC
2F619B90
122
1
60499
2F619CAC 2F619CAC
2F619B90
181
1
47252
2F619C64 2F619C64
2F619B90
5127
3
31908
2F619C04 2F619C04
2F619B90
54768
1
73280
2F619C0C 2F619C0C
2F619B90
54768
1
256874
2F619C4C 2F619C4C
2F619B90
54769
1
73746
2F619CFC 2F619CFC
2F619B90
54769
1
73513
28BE54B4 2F619C84
9
rows selected.
|
注意DBA(1, 51823),它的NXT_HASH与PRV_HASH相同,也就是说DBA(1, 51823)挂载在只包含有1个data block的 Hash Chain上。
我们这里查询出了9条记录,和我们在上面count(*)统计的数据一致,如果我们查出来的比上面少,就说明有缺少的N个block被刷到磁盘上了。
当一个用户进程想要访问Block(1,38576), 那么步骤如下:
(1)对该Block运用Hash算法,得到Hash值。
(2)获得cache buffers chains latch
(3)到相应的Hash Bucket中搜寻相应Buffer Header
(4)如果找到相应的Buffer Header,然后判断该Buffer的状态,看是否需要构造CR Block,或者Buffer处于pin的状态,最后读取。
CR (consistent read) blocks create 说明
http://blog.csdn.net/tianlesoftware/archive/2011/06/07/6529401.aspx
(5)如果找不到,就从磁盘读入到Buffer Cache中。
在Oracle9i以前,如果其它用户进程已经获得了这个latch,那么新的进程就必须等待,直到该用户进程搜索完毕(搜索完毕之后就会释放该latch)。
从Oracle9i开始 cache buffers chains latch可以只读共享,也就是说用户进程A以只读(select)的方式访问Block(1,73746),这个时候获得了该latch,同时用户进程B也以只读的方式访问Block(1,73513),那么这个时候由于是只读的访问,用户进程B也可以获得该latch。但是,如果用户进程B要以独占的方式访问Block(1,73513),那么用户进程B就会等待用户进程A释放该latch,这个时候Oracle就会对用户进程B标记一个latch:cache buffers chains的等待事件。
一般来说,导致latch:cache buffers chains 的原因有如下三种:
1. 不够优化的SQL
大量逻辑读的SQL语句就有可能产生非常严重的latch:cache buffers chains等待,因为每次要访问一个block,就需要获得该latch,由于有大量的逻辑读,那么就增加了latch:cache buffers chains争用的机率。
(1)对于正在运行的SQL语句,产生非常严重的latch:cache buffers chains争用,可以利用下面SQL查看执行计划,并设法优化SQL语句。
SQL>select * from table(dbms_xplan.display_cursor('sql_id',sql_child_number));
(2)如果SQL已经运行完毕,我们就看AWR报表里面的SQL Statistics->SQL ordered by Gets->Gets per Exec,试图优化这些SQL。
2. 热点块争用
(1)下面查询查出Top 5 的争用的latch address
|
1
2
3
4
5
6
7
8
9
10
11
12
13
14
|
/* Formatted on 2011/6/28 17:28:30 (QP5 v5.163.1008.3004) */
SELECT *
FROM ( SELECT CHILD#,
ADDR,
GETS,
MISSES,
SLEEPS
FROM v$latch_children
WHERE name =
'cache buffers chains'
AND misses >
0
AND sleeps >
0
ORDER BY
5
DESC,
1
,
2
,
3
)
WHERE ROWNUM <
6
;
|
(2)然后利用下面查询找出Hot block
|
1
2
3
4
5
6
7
8
9
10
11
12
13
14
|
/* Formatted on 2011/6/28 17:29:09 (QP5 v5.163.1008.3004) */
SELECT
/*+ RULE */
e.owner ||
'.'
|| e.segment_name segment_name,
e.extent_id extent#,
x.dbablk - e.block_id +
1
block#,
x.tch,
/* sometimes tch=0,we need to see tim */
x.tim,
l.child#
FROM v$latch_children l, x$bh x, dba_extents e
WHERE x.hladdr =
'&ADDR'
AND e.file_id = x.file#
AND x.hladdr = l.addr
AND x.dbablk BETWEEN e.block_id AND e.block_id + e.blocks -
1
ORDER BY x.tch DESC;
|
3. Hash Bucket太少
需要更改_db_block_hash_buckets隐含参数。其实在Oracle9i之后,我们基本上不会遇到这个问题了,除非遇到Bug。所以这个是不推荐的,记住,在对Oracle的隐含参数做修改之前一定要咨询Oracle Support。
2.8.2 LRU List 和 Write List
前面已经提到过了,如果一个用户进程发现某个block不在Buffer Cache中,那么用户进程就会从磁盘上将这个block读入Buffer Cache。
在将block读入到Buffer Cache之前,首先要在LRU list上寻找Free的buffer,在寻找过程中,如果发现了Dirty Buffer就将其移动到 LRU Write List上。
如果Dirty Queue超过了阀值25%(如下面查询所示),那么DBWn就会将Dirty Buffer写入到磁盘中。
|
1
2
3
4
5
6
|
SYS@node2(rac2)> select kvittag,kvitval,kvitdsc
from
x$kvit
where
kvittag
in
(
'kcbldq'
,
'kcbfsp'
);
KVITTAG KVITVAL KVITDSC
---------- ---------- ----------------------------------------------------------
kcbldq
25
large dirty queue
if
kcbclw reaches
this
kcbfsp
40
Max percentage of LRU list foreground can scan
for
free
|
根据上面的查询我们还知道,当某个用户进程扫描LRU list超过40%都还没找到Free Buffer,那么这个时候用户进程将停止扫描LRU list,同时通知DBWn将Dirty Buffer写入磁盘,用户进程也将记录一个free buffer wait等待事件。如果我们经常看到free buffer wait等待事件,那么我们就应该考虑加大Buffer Cache了。
从Oracle8i开始,LRU List和Dirty List都增加了辅助List(Aux List),Oracle将LRU List和LRU Write List统称为Working Set(WS)。每个WS中都包含了几个功能不同的List,每个WS都会有一个Cache Buffers LRU chain Latch的保护(知识来源于DSI405)。如果数据库设置了多个DBWR,数据库会存在多个WS,如果Buffer Cache中启用了多缓存池(default,keep,recycle)时,每个独立的缓冲池都会有自己的WS。那么下面我们来查询一下,以验证上述理论:
|
1
2
3
4
5
6
7
8
9
10
11
12
13
14
15
16
17
18
19
20
21
22
|
SYS@node2(rac2)> SELECT x.ksppinm NAME, y.ksppstvl VALUE, x.ksppdesc describ
2
FROM x$ksppi x, x$ksppcv y
3
WHERE x.inst_id = USERENV (
'Instance'
)
4
AND y.inst_id = USERENV (
'Instance'
)
5
AND x.indx = y.indx
6
AND x.ksppinm LIKE
'%db_block_lru_latches%'
7
/
NAME VALUE DESCRIB
------------------------ ---------- --------------------------------------------
_db_block_lru_latches
32
number of lru latches
SYS@anqing2(rac2)> show parameter db_writer
NAME TYPE VALUE
------------------------------------ ----------- ------------------------------
db_writer_processes integer
2
SYS@anqing2(rac2)> show parameter cpu_count
NAME TYPE VALUE
------------------------------------ -------------------- ------------
cpu_count integer
8
|
我们查到有32个Cache Buffers LRU chain Latch,从Oracle9i开始,_db_block_lru_latches是CPU_COUNT的4倍,如果DB_WITER_PROCESS小于4,置于DB_WITER_PROCESS大于四这个不知道,另外也没见过哪个数据库参数的DB_WITER_PROCESS大于4,
查询一下有多少个Working Set:
|
1
2
3
4
|
SYS@node2(rac2)>select count(*)
from
x$kcbwds;
COUNT(*)
----------
32
|
我们查询到有32个WS,并不代表数据库就一定使用了这32个WS,有些WS 是数据库预分配的,这样在我们启用Keep pool, recycle pool的时候就不用重启数据库了。
那么我们这里就只是用了4个WS。
|
1
2
3
4
|
SYS@node2(rac2)>select count(*)
from
x$kcbwds
where
CNUM_REPL>
0
;
COUNT(*)
----------
4
|
查看X$KCBWDS基表主要字段:
ADDR RAW(4) --address
INST_ID NUMBER --instance number
SET_ID NUMBER --work set id
DBWR_NUM NUMBER --dbwr编号
BLK_SIZE NUMBER --workset的block size
CKPT_LATCH RAW(4) --checkpoint latch
SET_LATCH RAW(4) --next replacement chain
NXT_REPL RAW(4) --prv replacement chain
PRV_REPL RAW(4) --replacement aux chain
NXT_REPLAX RAW(4)
PRV_REPLAX RAW(4)
CNUM_REPL NUMBER --replacement chian上的block数
ANUM_REPL NUMBER --aux chain上的block 数
COLD_HD RAW(4) --cold head的地址
HBMAX NUMBER --hot端的最大buffer数量
HBUFS NUMBER --hot端的当前buffer数量
NXT_WRITE RAW(4) --lru-w链
PRV_WRITE RAW(4) --lru-w链
NXT_WRITEAX RAW(4) --lru-w aux链
PRV_WRITEAX RAW(4) --lru-w aux链
CNUM_WRITE NUMBER --lru-w的buffer数
ANUM_WRITE NUMBER --lru-w aux的buffer数
NXT_XOBJ RAW(4) --reuse obj链(当truncate,drop等操作时使用)
PRV_XOBJ RAW(4) --reuse obj链
NXT_XOBJAX RAW(4) --reuse obj aux链
NXT_XRNG RAW(4) --reuse range链(tablespace offline等操作的时候使用)
NXT_XRNGAX RAW(4) --reuse range aux链
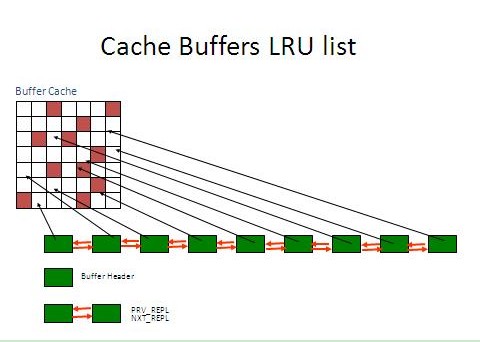
注意红色字段,正是由于红色字段,以及前面提到过的x$bh中的NXT_REPL,PRV_REPL 字段形成了LRU List 以及LRU Write List。
下图就是LRU List的结构示意图
新增的辅助list(AUX List)作用:
在数据库启动之后,Buffer首先被存放在LRU AUX List上,用户进程搜索Free Buffer就会从LRU AUX List 的末/冷端进行。当这些块被修改后或者是用户进程要构造CR块的时候(要构造CR块也就表明这个块不满足读一致性,是Dirty的),在LRU AUX List上的Buffer就会被移动到LRU Main List的中间,记住是中间不是头部也不是末尾,那么DBWR来搜索Dirty Buffer就可以从LRU Main List开始(注意:DBWR 来搜索LRU Main List 是由于增量检查点导致的),DBWR在搜索LRU Main List的时候如果发现冷的可以被重复使用的Buffer,就会将其移动到LRU AUX List上,这样搜索LRU Main List上的Buffer基本都是Dirty Buffer,提高了搜索效率。
DBWR将搜索到的Dirty Buffer移动到LRUW Main List,当需要将这个Dirty Buffer写出的时候,就把这个Dirty Buffer移动到LRUW AUX List,这样,当DBWR要执行写出可以从LRUW AUX List写出,这其实是一个异步的写出机制。(From Metalink: 157868.1)
根据上面的讲解,当用户进程要将Block从磁盘读入到Buffer Cache中需要获得Cache Buffers LRU chain Latch,或者是DBWR扫描LRU Main List的时候要获得Cache Buffers LRU chain Latch。
所以,当我们发现AWR报表上面Cache Buffers LRU chain Latch排名很靠前,那么我们可以采取如下方法:
(1)加大Buffer Cache,过小的Buffer Cache导致大量的磁盘I/O,必然引发Cache Buffers LRU chain Latch竞争。
(2)优化具有大量全表扫描,高磁盘I/O的SQL。如果SQL效率很低,大量的全表扫描,或者扫描没有选择性的索引就会引发这个问题。
(3)使用多缓冲池技术,把Hot Segments Keep起来,Hot Segments的信息可以从AWR 报表中的Segments Statistics中得到。