1.jcmd
1.1作用
发送诊断命令请求到正在运行的Java虚拟机(JVM)。
它必须和JVM运行在同一台机器上,并且与启动JVM用户具有相同的组权限。
1.2语法
|
1
2
3
4
|
jcmd [-l|-h|-help]
jcmd pid|main-class PerfCounter.print
jcmd pid|main-class -f filename
jcmd pid|main-class
command
[ arguments]
|
Perfcounter.print:打印Java进程的性能计数器
-f filename:从中读取诊断命令,每行命令必须在一行内写完
command [arguments]:诊断指令
1.3命令列表
|
1
2
3
4
5
6
7
8
9
10
11
12
13
14
15
16
17
18
|
C:\Users\Administrator>jcmd 7048 help
7048:
The following commands are available:
VM.native_memory
VM.commercial_features
ManagementAgent.stop
ManagementAgent.start_local
ManagementAgent.start
Thread.print
GC.class_histogram
GC.heap_dump
GC.run_finalization
GC.run
VM.uptime
VM.flags
VM.system_properties
VM.command_line
VM.version
|
|
1
2
3
4
5
6
7
8
9
10
11
12
13
14
15
16
17
18
19
20
21
22
23
24
25
26
27
28
29
30
31
32
33
34
35
36
37
38
39
40
41
42
43
44
45
46
47
48
49
50
51
52
53
54
55
56
57
58
59
60
61
62
63
64
65
66
67
68
69
70
71
72
73
74
75
76
77
78
79
80
81
82
83
84
85
86
87
88
89
90
91
92
93
|
#打印JDK及版本
C:\Users\Administrator>jcmd 7048 VM.version
7048:
Java HotSpot(TM) 64-Bit Server VM version 24.75-b04
JDK 7.0_75
#打印虚拟机系统属性
可以有几百行的信息显示。
C:\Users\Administrator>jcmd 7048 VM.system_properties
7048:
#Sat Apr 15 21:24:31 CST 2017
java.runtime.name=Java(TM) SE Runtime Environment
sun.boot.library.path=D\:\\Java\\jdk1.7.0_75\\jre\\bin
java.vm.version=24.75-b04
shared.loader=
java.vm.vendor=Oracle Corporation
java.vendor.url=http\:
//java
.oracle.com/
path.separator=;
java.vm.name=Java HotSpot(TM) 64-Bit Server VM
tomcat.util.buf.StringCache.byte.enabled=
true
file
.encoding.pkg=sun.io
...
#打印用于虚拟机的所有标志
即使没有设置,一些默认值将被打印出来
C:\Users\Administrator>jcmd 7048 VM.flags
7048:
-XX:InitialHeapSize=132669696 -XX:MaxHeapSize=2124414976 -XX:+UseCompressedOops
-XX:-UseLargePagesIndividualAllocation -XX:+UseParallelGC
7048:
[Global flags]
uintx AdaptivePermSizeWeight = 20 {product}
uintx AdaptiveSizeDecrementScaleFactor = 4 {product}
uintx AdaptiveSizeMajorGCDecayTimeScale = 10 {product}
uintx AdaptiveSizePausePolicy = 0 {product}
uintx AdaptiveSizePolicyCollectionCostMargin = 50 {product}
uintx AdaptiveSizePolicyInitializingSteps = 20 {product}
uintx AdaptiveSizePolicyOutputInterval = 0 {product}
uintx AdaptiveSizePolicyWeight = 10 {product}
uintx AdaptiveSizeThroughPutPolicy = 0 {product}
uintx AdaptiveTimeWeight = 25 {product}
bool AdjustConcurrency =
false
{product}
bool AggressiveOpts =
false
{product}
intx AliasLevel = 3 {C2 product}
bool AlignVector =
true
{C2 product}
uintx InitialHeapSize := 132669696 {product}
...
#冒号:表示非默认值
#打印(秒)正常运行时间
C:\Users\Administrator>jcmd 7048 VM.uptime
7048:
2213.664 s
#类直方图
C:\Users\Administrator>jcmd 7048 GC.class_histogram > 12333.txt
7048:
num
#instances #bytes class name
----------------------------------------------
1: 11678 8137440 [B
2: 30213 4300992 [C
3: 28188 3966976 <constMethodKlass>
4: 28188 3619568 <methodKlass>
5: 2339 2866712 <constantPoolKlass>
6: 2038 1698944 <constantPoolCacheKlass>
7: 2339 1659448 <instanceKlassKlass>
8: 28718 689232 java.lang.String
9: 16608 531456 java.util.HashMap$Entry
10: 736 416896 <methodDataKlass>
11: 6144 369080 [Ljava.lang.Object;
12: 2620 254960 java.lang.Class
13: 877 234768 [Ljava.util.HashMap$Entry;
14: 3569 229624 [S
15: 3773 214248 [[I
....
#创建堆转储(HPROF)
C:\Users\Administrator>jcmd 7048 GC.heap_dump filename=Myheapdump
7048:
Heap dump
file
created
与jmap -dump:
file
=<
file
> <pid>功能一样
#创建一个堆直方图
jcmd <process
id
/main
class> GC.class_histogram filename=Myheaphistogram
使用jmap -histo <pid>
打印线程的栈信息
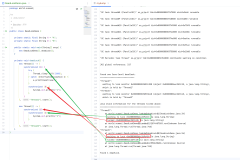
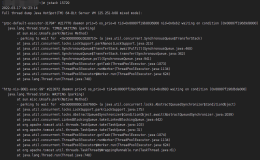
C:\Users\Administrator>jcmd 7048 Thread.print
7048:
2017-04-15 21:43:28
Full thread dump Java HotSpot(TM) 64-Bit Server VM (24.75-b04 mixed mode):
"ajp-bio-8009-AsyncTimeout"
daemon prio=6 tid=0x000000000d5bb000 nid=0x78c waiting on condition [0x000000000f16f000]
java.lang.Thread.State: TIMED_WAITING (sleeping)
at java.lang.Thread.
sleep
(Native Method)
at org.apache.tomcat.util.net.JIoEndpoint$AsyncTimeout.run(JIoEndpoint.java:152)
at java.lang.Thread.run(Thread.java:745)
.......
|
| {product} |
| {C2 product} |
| {pd product} |
| {C1 product} |
| {manageable}:运行时动态更改 |
| {C2 pd product} |
| {ARCH product} |
| {C1 pd product} |
| {lp64_product} |
| {product rw} |
(2)jstack
2.1 作用
打印Java进程,核心文件或者远程调试服务器的Java线程堆栈跟踪.
-
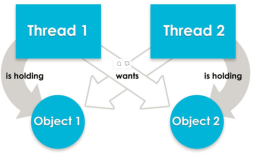
死锁监测和HANG
-
使用jsadebugd 守护进程查询远程机器上的core文件及进程
-
-l,可以打印java.util.concurrent.locks同步信息和堆上的同步器,没有该选项,仅仅是监视器的信息。
-
jstack pid 与 ctrl+break
-
也可以Thread.getAllStackTraces
2.2 语法
|
1
2
3
|
jstack [ options ] pid
jstack [ options ] executable core
jstack [ options ] [ server-
id
@ ] remote-
hostname
-or-IP
|
每一个栈帧,打印信息包括类名,方法名,字节码索引(BCI),和行数。-m开关,同时打印本地和java栈帧信息。
当指定的进程在一个64位Java虚拟机上运行,则可能需要指定-J-d64选项,例如:jstack -J-d64 -m pid。
2.3 参数Options
-F:强制dump
-l:打印额外信息
-m:打印混合堆栈信息(c++,java)
http://docs.oracle.com/javase/8/docs/technotes/tools/unix/jstack.html
http://docs.oracle.com/javase/8/docs/technotes/guides/troubleshoot/tooldescr016.html
https://docs.oracle.com/javase/8/docs/technotes/guides/troubleshoot/tooldescr006.html
https://docs.oracle.com/javase/8/docs/technotes/tools/windows/jcmd.html
https://docs.oracle.com/javase/8/docs/technotes/guides/troubleshoot/tooldescr006.html