刚接触到ZedGraph,到网上搜素到的方法基本上都是使用临时文件来存储图片,然后再显示,但是临时图片太多的话会占用大量的空间。很不划算。最后看到有人说把RenderMode="RawImage"就可以了 ,但是会出现乱码。如何解决呢?下面是我的方法。
新建一个目录,命名为bin,把文件ZedGraph.Web.dll,ZedGraph.dll拷到bin目录下面。
建立文件tuppian.aspx。其内容为:
<%@ Page Language="C#" AutoEventWireup="true" CodeFile="tuppian.aspx.cs" Inherits="tuppian" %>
<%@ Register assembly="ZedGraph.Web" namespace="ZedGraph.Web" tagprefix="cc1" %>
<%--
特别注意了:本页面不要有HTML代码,和asp.net代码。不然会出现乱码,RenderMode="RawImage"一定要设置RawImage,不然会报错。
--%>
<cc1:ZedGraphWeb ID="ZedGraphWeb1" runat="server" RenderMode="RawImage">
</cc1:ZedGraphWeb>
tuppian.aspx.cs为:
using System;
using System.Data;
using System.Configuration;
using System.Collections;
using System.Web;
using System.Web.Security;
using System.Web.UI;
using System.Web.UI.WebControls;
using System.Web.UI.WebControls.WebParts;
using System.Web.UI.HtmlControls;
using System.Drawing;
using ZedGraph;
using ZedGraph.Web;
public partial class tuppian : System.Web.UI.Page
{
DarwGrapClass dg = new DarwGrapClass();
protected void Page_Load(object sender, EventArgs e)
{
}
protected override void OnInit(EventArgs e)
{
InitializeComponent();
base.OnInit(e);
}
private void InitializeComponent()
{
string id = Request.QueryString["id"];
switch (id)
{
case "1":
DrawLine();
break;
case "2":
DrawPie();
break;
default:
DrawBar();
break;
}
}
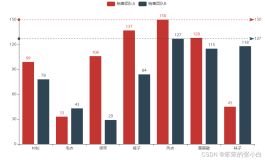
private void DrawBar()
{
dg.Type = AnalyticsType.Bar;
dg.Title = "用户访问柱状图";
dg.XAxisTitle = "月份";
dg.YAxisTitle = "用户访问数量";
Random rand = new Random();
string[] aa = { "企业1", "企业2", "企业3" };
for (int i = 0; i < 2; i++)
{
ZedGraph.PointPairList ppl = new ZedGraph.PointPairList();
for (int j = 0; j < 12; j++)
{
double x = rand.Next(10);
double y = rand.NextDouble() * 100;
ppl.Add(x, y);
//dg.NameList.Add((j + 1).ToString() + "月");
//ppl.Add(j+1,j+1);以此递增
//dg.NameList.Add("第" + j.ToString() + "月份");
}
dg.DataSource.Add(ppl);
dg.LabelList.Add("企业" + i.ToString());
//dg.NameList.Add((i + 1).ToString() + "月");
}
for (int k = 0; k < 12; k++)
{
dg.NameList.Add((k + 1).ToString() + "月");
}
dg.y_step = 5;
dg.DarwGrap(ZedGraphWeb1);
}
private void DrawPie()
{
dg.Type = AnalyticsType.Pie;
dg.Title = "用户访问饼图";
Random rand = new Random();
for (int i = 0; i < 3; i++)
{
dg.ScaleData.Add((i + 2) * rand.Next(100));
dg.NameList.Add("企业:" + i.ToString());//各个部分所代表的含义
}
dg.DarwGrap(ZedGraphWeb1);
}
private void DrawLine()
{
dg.Type = AnalyticsType.Line;
dg.Title = "用户访问曲线图";
dg.XAxisTitle = "月份";
dg.YAxisTitle = "用户访问数量";
Random rand = new Random();
for (int i = 0; i < 2; i++)
{
ZedGraph.PointPairList ppl = new ZedGraph.PointPairList();
//数据源添加
for (double x = 0; x < 12; x += 1.0)
{
double y = rand.NextDouble() * 100;
ppl.Add(x, y);
}
//从数据库中取得
//for (int i = 0; i < this.dt.Rows.Count; i++) //这个循环主要是取到里面的说明文字,用了一个数组的方法
//{
// ppl.Add(i,this.dt.Rows[i].Cells[1].Text.Trim());
//}
//dg.NameList.Add("第" + i.ToString() + "月份");
dg.DataSource.Add(ppl);
dg.NameList.Add("企业:" + i.ToString());
}
//改变x组的显示字符,当然也可以绑定数据库,从数据库中取得。
for (int k = 0; k < 12; k++)
{
dg.LabelList.Add((k + 1).ToString() + "月");
}
//for (int i = 0; i < this.dt.Rows.Count; i++) //这个循环主要是取到里面的说明文字,用了一个数组的方法
//{
// dg.LabelList.Add(this.dt.Rows[i].Cells[0].Text.Trim());
//}
dg.DarwGrap(ZedGraphWeb1);
}
}
新建一个类DarwGrapClass.cs,放在App_Code目录下面。其内容为:
using System;
using System.Data;
using System.Configuration;
using System.Web;
using System.Web.Security;
using System.Web.UI;
using System.Web.UI.HtmlControls;
using System.Web.UI.WebControls;
using System.Web.UI.WebControls.WebParts;
using System.Drawing;
using ZedGraph;
using ZedGraph.Web;
using System.Collections.Generic;
public enum AnalyticsType
{
Line, //折线图
Line2,//带阴影区域的折线图
Curve,//带星的折线图
Curve2,//带阴影区域的星行折线图
Bar, //柱状图
Graph,
Pie //饼图
};
public class DarwGrapClass
{
public DarwGrapClass()
{
//
//TODO: 在此处添加构造函数逻辑
//
}
#region Private Attribute
/**/
///
/// 默认颜色种类
///
private List<Color> defaultColors = new List<Color>();
/**/
///
/// 统计的个数
///
private int Count;
#endregion
//Public Property;
#region Public Property
/**/
///
/// 统计图的名称
///
public string Title;
/**/
///
/// 横轴的名称(饼图不需要)
///
public string XAxisTitle;
/**/
///
/// 纵轴的名称(饼图不需要)
///
public string YAxisTitle;
/**/
///
/// 显示的曲线类型:Line,Bar,Pie
///
public AnalyticsType Type;
/**/
///
/// 折线图和柱状图的数据源
///
public List<PointPairList> DataSource = new List<PointPairList>();
/**/
///
/// 饼图的数据源
///
public List<double> ScaleData = new List<double>();
/**/
///
/// 各段数据的颜色
///
public List<Color> Colors = new List<Color>();
/**/
///
/// 各段数据的名称
///
public List<string> NameList = new List<string>();
/**/
///
/// 用于柱状图,每个圆柱体表示的含义
///
public List<string> LabelList = new List<string>();
public double y_step;
public double x_step;
#endregion
public void DarwGrap(ZedGraphWeb ZedGraph)
{
ZedGraph.RenderGraph += new ZedGraph.Web.ZedGraphWebControlEventHandler(zedGraphControl_RenderGraph);
}
private void InitDefaultColors()
{
defaultColors.Add(Color.Red);
defaultColors.Add(Color.Green);
defaultColors.Add(Color.Blue);
defaultColors.Add(Color.Yellow);
defaultColors.Add(Color.YellowGreen);
defaultColors.Add(Color.Brown);
defaultColors.Add(Color.Aqua);
defaultColors.Add(Color.Cyan);
defaultColors.Add(Color.DarkSeaGreen);
defaultColors.Add(Color.Indigo);
}
/**/
///
/// 如果属性为空则初始化属性数据
///
private void InitProperty()
{
InitDefaultColors();
if (string.IsNullOrEmpty(Title))
{
Title = "未命名统计图";
}
if (string.IsNullOrEmpty(XAxisTitle))
{
XAxisTitle = "横轴";
}
if (string.IsNullOrEmpty(YAxisTitle))
{
YAxisTitle = "纵轴";
}
if (Type == AnalyticsType.Pie)
{
Count = ScaleData.Count;
}
else
{
Count = DataSource.Count;
}
if (Colors.Count == 0 || Colors.Count != Count)
{
Random r = new Random();
int tempIndex = 0;
List<int> tempIndexList = new List<int>();
for (int i = 0; i < Count; i++)
{
tempIndex = r.Next(defaultColors.Count);
if (tempIndexList.Contains(tempIndex))
{
i--;
}
else
{
tempIndexList.Add(tempIndex);
Colors.Add(defaultColors[tempIndex]);
}
}
}
if (NameList.Count == 0)
{
if (Type == AnalyticsType.Bar)
{
for (int i = 1; i < DataSource[0].Count + 1; i++)
{
NameList.Add("第" + i.ToString() + "组");
}
}
else
{
for (int i = 1; i < Count + 1; i++)
{
NameList.Add("第" + i.ToString() + "组");
}
}
}
if (LabelList.Count == 0)
{
for (int i = 0; i < Count; i++)
{
LabelList.Add("含义" + i.ToString());
}
}
if (x_step == 0.0)
x_step = 5;
if (y_step == 0.0)
y_step = 5;
}
/**/
///
/// 画图
///
///
///
///
private void zedGraphControl_RenderGraph(ZedGraphWeb zgw, System.Drawing.Graphics g, ZedGraph.MasterPane masterPane)
{
InitProperty();
GraphPane myPane = masterPane[0];
myPane.Title.Text = Title;
myPane.XAxis.Title.Text = XAxisTitle;
myPane.YAxis.Title.Text = YAxisTitle;
//if (true)
//{
// DrawMessage(myPane, "yiafdhaskjhfasfksahfasdlhfaslf lasgfasglgsadi");
// pane.AxisChange(g);
// return;
//}
switch (Type)
{
case AnalyticsType.Line:
DrawLine(myPane);
break;
case AnalyticsType.Bar:
DrawBar(myPane);
break;
case AnalyticsType.Pie:
DrawPie(myPane);
break;
case AnalyticsType.Line2:
DrawLine2(myPane);
break;
case AnalyticsType.Curve:
DrawCurve(myPane);
break;
case AnalyticsType.Curve2:
DrawCurve2(myPane);
break;
default:
break;
}
masterPane.AxisChange(g);
}
#region Draw
/**/
///
/// 画折线图
///
///
private void DrawLine(GraphPane graphPane)
{
for (int i = 0; i < Count; i++)
{
graphPane.AddCurve(NameList[i], DataSource[i], Colors[i], SymbolType.None);
string[] labels = LabelList.ToArray();
graphPane.XAxis.Scale.TextLabels = labels;
graphPane.XAxis.Type = AxisType.Text;
graphPane.Chart.Fill = new Fill(Color.White, Color.FromArgb(255, 255, 166), 90F);
graphPane.Fill = new Fill(Color.FromArgb(250, 250, 255));
graphPane.YAxis.Scale.MajorStep = y_step;
}
}
/**/
///
/// 画折线图,带阴影区域
///
///
private void DrawLine2(GraphPane graphPane)
{
for (int i = 0; i < Count; i++)
{
graphPane.AddCurve(NameList[i], DataSource[i], Colors[i], SymbolType.None).Line.Fill = new Fill(Color.White, Colors[i], 90F);
string[] labels = LabelList.ToArray();
graphPane.XAxis.Scale.TextLabels = labels;
graphPane.XAxis.Type = AxisType.Text;
graphPane.Chart.Fill = new Fill(Color.White, Color.FromArgb(255, 255, 166), 90F);
graphPane.Fill = new Fill(Color.FromArgb(250, 250, 255));
graphPane.YAxis.Scale.MajorStep = y_step;
}
}
/**/
///
/// 画星行折线图
///
///
private void DrawCurve(GraphPane graphPane)
{
for (int i = 0; i < Count; i++)
{
graphPane.AddCurve(NameList[i], DataSource[i], Colors[i], SymbolType.Star);
string[] labels = LabelList.ToArray();
graphPane.XAxis.Scale.TextLabels = labels;
graphPane.XAxis.Type = AxisType.Text;
graphPane.Chart.Fill = new Fill(Color.White, Color.FromArgb(255, 255, 166), 90F);
graphPane.Fill = new Fill(Color.FromArgb(250, 250, 255));
graphPane.YAxis.Scale.MajorStep = y_step;
}
}
/**/
///
/// 画星行折线图,带阴影区域
///
///
private void DrawCurve2(GraphPane graphPane)
{
for (int i = 0; i < Count; i++)
{
graphPane.AddCurve(NameList[i], DataSource[i], Colors[i], SymbolType.Star).Line.Fill = new Fill(Color.White, Colors[i],90F);
string[] labels = LabelList.ToArray();
graphPane.XAxis.Scale.TextLabels = labels;
graphPane.XAxis.Type = AxisType.Text;
graphPane.Chart.Fill = new Fill(Color.White, Color.FromArgb(255, 255, 166), 90F);
graphPane.Fill = new Fill(Color.FromArgb(250, 250, 255));
graphPane.YAxis.Scale.MajorStep = y_step;
}
}
/**/
///
/// 画柱状图
///
///
private void DrawBar(GraphPane graphPane)
{
for (int i = 0; i < Count; i++)
{
graphPane.AddBar(LabelList[i], DataSource[i], Colors[i]).Bar.Fill = new Fill(Colors[i], Color.White, Colors[i]);
//.Line.Fill = new Fill(Color.White, Color.Red, 45F);
//.Line.Fill = new Fill(Color.White, Color.Blue, 45F);
}
graphPane.XAxis.MajorTic.IsBetweenLabels = true;
string[] labels = NameList.ToArray();
graphPane.XAxis.Scale.TextLabels = labels;
graphPane.XAxis.Type = AxisType.Text;
graphPane.Chart.Fill = new Fill(Color.White, Color.FromArgb(255, 255, 166), 90F);
//graphPane.Fill = new Fill(Color.FromArgb(250, 250, 255));
graphPane.Fill = new Fill(Color.White, Color.FromArgb(200, 200, 255), 45.0f);
//graphPane.Chart.Fill = new Fill(Color.White, Color.LightGoldenrodYellow, 45.0f);
graphPane.YAxis.Scale.MajorStep = y_step;
//graphPane.BaseDimension =8;
}
/**/
///
/// 画饼图
///
///
private void DrawPie(GraphPane graphPane)
{
graphPane.Fill = new Fill(Color.White, Color.Silver, 45.0f);
graphPane.Legend.Position = LegendPos.Float;
graphPane.Legend.Location = new Location(0.95f, 0.15f, CoordType.PaneFraction, AlignH.Right, AlignV.Top);
graphPane.Legend.FontSpec.Size = 20f;
graphPane.Legend.IsHStack = false;
for (int i = 0; i < Count; i++)
{
graphPane.AddPieSlice(ScaleData[i], Colors[i], Color.White, 45f, 0, NameList[i]);
}
}
/**/
///
/// 如果系统出错,显示错误信息
///
///
///
private void DrawMessage(GraphPane graphPane, string message)
{
TextObj text = new TextObj(message, 200, 200);
text.Text = message;
graphPane.GraphObjList.Add(text);
}
#endregion
}
最后,注意当画饼图时,有时注释会把图片遮住,这时只要设置图片长和高的比例就可以了。曲线图和直方图的x組的说明文字如果太多的话,就会屏蔽掉一些,这是也只要设置长和高的比例就可以解决问题了。
新建一个目录,命名为bin,把文件ZedGraph.Web.dll,ZedGraph.dll拷到bin目录下面。
建立文件tuppian.aspx。其内容为:
<%@ Page Language="C#" AutoEventWireup="true" CodeFile="tuppian.aspx.cs" Inherits="tuppian" %>
<%@ Register assembly="ZedGraph.Web" namespace="ZedGraph.Web" tagprefix="cc1" %>
<%--
特别注意了:本页面不要有HTML代码,和asp.net代码。不然会出现乱码,RenderMode="RawImage"一定要设置RawImage,不然会报错。
--%>
<cc1:ZedGraphWeb ID="ZedGraphWeb1" runat="server" RenderMode="RawImage">
</cc1:ZedGraphWeb>
tuppian.aspx.cs为:
using System;
using System.Data;
using System.Configuration;
using System.Collections;
using System.Web;
using System.Web.Security;
using System.Web.UI;
using System.Web.UI.WebControls;
using System.Web.UI.WebControls.WebParts;
using System.Web.UI.HtmlControls;
using System.Drawing;
using ZedGraph;
using ZedGraph.Web;
public partial class tuppian : System.Web.UI.Page
{
DarwGrapClass dg = new DarwGrapClass();
protected void Page_Load(object sender, EventArgs e)
{
}
protected override void OnInit(EventArgs e)
{
InitializeComponent();
base.OnInit(e);
}
private void InitializeComponent()
{
string id = Request.QueryString["id"];
switch (id)
{
case "1":
DrawLine();
break;
case "2":
DrawPie();
break;
default:
DrawBar();
break;
}
}
private void DrawBar()
{
dg.Type = AnalyticsType.Bar;
dg.Title = "用户访问柱状图";
dg.XAxisTitle = "月份";
dg.YAxisTitle = "用户访问数量";
Random rand = new Random();
string[] aa = { "企业1", "企业2", "企业3" };
for (int i = 0; i < 2; i++)
{
ZedGraph.PointPairList ppl = new ZedGraph.PointPairList();
for (int j = 0; j < 12; j++)
{
double x = rand.Next(10);
double y = rand.NextDouble() * 100;
ppl.Add(x, y);
//dg.NameList.Add((j + 1).ToString() + "月");
//ppl.Add(j+1,j+1);以此递增
//dg.NameList.Add("第" + j.ToString() + "月份");
}
dg.DataSource.Add(ppl);
dg.LabelList.Add("企业" + i.ToString());
//dg.NameList.Add((i + 1).ToString() + "月");
}
for (int k = 0; k < 12; k++)
{
dg.NameList.Add((k + 1).ToString() + "月");
}
dg.y_step = 5;
dg.DarwGrap(ZedGraphWeb1);
}
private void DrawPie()
{
dg.Type = AnalyticsType.Pie;
dg.Title = "用户访问饼图";
Random rand = new Random();
for (int i = 0; i < 3; i++)
{
dg.ScaleData.Add((i + 2) * rand.Next(100));
dg.NameList.Add("企业:" + i.ToString());//各个部分所代表的含义
}
dg.DarwGrap(ZedGraphWeb1);
}
private void DrawLine()
{
dg.Type = AnalyticsType.Line;
dg.Title = "用户访问曲线图";
dg.XAxisTitle = "月份";
dg.YAxisTitle = "用户访问数量";
Random rand = new Random();
for (int i = 0; i < 2; i++)
{
ZedGraph.PointPairList ppl = new ZedGraph.PointPairList();
//数据源添加
for (double x = 0; x < 12; x += 1.0)
{
double y = rand.NextDouble() * 100;
ppl.Add(x, y);
}
//从数据库中取得
//for (int i = 0; i < this.dt.Rows.Count; i++) //这个循环主要是取到里面的说明文字,用了一个数组的方法
//{
// ppl.Add(i,this.dt.Rows[i].Cells[1].Text.Trim());
//}
//dg.NameList.Add("第" + i.ToString() + "月份");
dg.DataSource.Add(ppl);
dg.NameList.Add("企业:" + i.ToString());
}
//改变x组的显示字符,当然也可以绑定数据库,从数据库中取得。
for (int k = 0; k < 12; k++)
{
dg.LabelList.Add((k + 1).ToString() + "月");
}
//for (int i = 0; i < this.dt.Rows.Count; i++) //这个循环主要是取到里面的说明文字,用了一个数组的方法
//{
// dg.LabelList.Add(this.dt.Rows[i].Cells[0].Text.Trim());
//}
dg.DarwGrap(ZedGraphWeb1);
}
}
新建一个类DarwGrapClass.cs,放在App_Code目录下面。其内容为:
using System;
using System.Data;
using System.Configuration;
using System.Web;
using System.Web.Security;
using System.Web.UI;
using System.Web.UI.HtmlControls;
using System.Web.UI.WebControls;
using System.Web.UI.WebControls.WebParts;
using System.Drawing;
using ZedGraph;
using ZedGraph.Web;
using System.Collections.Generic;
public enum AnalyticsType
{
Line, //折线图
Line2,//带阴影区域的折线图
Curve,//带星的折线图
Curve2,//带阴影区域的星行折线图
Bar, //柱状图
Graph,
Pie //饼图
};
public class DarwGrapClass
{
public DarwGrapClass()
{
//
//TODO: 在此处添加构造函数逻辑
//
}
#region Private Attribute
/**/
///
/// 默认颜色种类
///
private List<Color> defaultColors = new List<Color>();
/**/
///
/// 统计的个数
///
private int Count;
#endregion
//Public Property;
#region Public Property
/**/
///
/// 统计图的名称
///
public string Title;
/**/
///
/// 横轴的名称(饼图不需要)
///
public string XAxisTitle;
/**/
///
/// 纵轴的名称(饼图不需要)
///
public string YAxisTitle;
/**/
///
/// 显示的曲线类型:Line,Bar,Pie
///
public AnalyticsType Type;
/**/
///
/// 折线图和柱状图的数据源
///
public List<PointPairList> DataSource = new List<PointPairList>();
/**/
///
/// 饼图的数据源
///
public List<double> ScaleData = new List<double>();
/**/
///
/// 各段数据的颜色
///
public List<Color> Colors = new List<Color>();
/**/
///
/// 各段数据的名称
///
public List<string> NameList = new List<string>();
/**/
///
/// 用于柱状图,每个圆柱体表示的含义
///
public List<string> LabelList = new List<string>();
public double y_step;
public double x_step;
#endregion
public void DarwGrap(ZedGraphWeb ZedGraph)
{
ZedGraph.RenderGraph += new ZedGraph.Web.ZedGraphWebControlEventHandler(zedGraphControl_RenderGraph);
}
private void InitDefaultColors()
{
defaultColors.Add(Color.Red);
defaultColors.Add(Color.Green);
defaultColors.Add(Color.Blue);
defaultColors.Add(Color.Yellow);
defaultColors.Add(Color.YellowGreen);
defaultColors.Add(Color.Brown);
defaultColors.Add(Color.Aqua);
defaultColors.Add(Color.Cyan);
defaultColors.Add(Color.DarkSeaGreen);
defaultColors.Add(Color.Indigo);
}
/**/
///
/// 如果属性为空则初始化属性数据
///
private void InitProperty()
{
InitDefaultColors();
if (string.IsNullOrEmpty(Title))
{
Title = "未命名统计图";
}
if (string.IsNullOrEmpty(XAxisTitle))
{
XAxisTitle = "横轴";
}
if (string.IsNullOrEmpty(YAxisTitle))
{
YAxisTitle = "纵轴";
}
if (Type == AnalyticsType.Pie)
{
Count = ScaleData.Count;
}
else
{
Count = DataSource.Count;
}
if (Colors.Count == 0 || Colors.Count != Count)
{
Random r = new Random();
int tempIndex = 0;
List<int> tempIndexList = new List<int>();
for (int i = 0; i < Count; i++)
{
tempIndex = r.Next(defaultColors.Count);
if (tempIndexList.Contains(tempIndex))
{
i--;
}
else
{
tempIndexList.Add(tempIndex);
Colors.Add(defaultColors[tempIndex]);
}
}
}
if (NameList.Count == 0)
{
if (Type == AnalyticsType.Bar)
{
for (int i = 1; i < DataSource[0].Count + 1; i++)
{
NameList.Add("第" + i.ToString() + "组");
}
}
else
{
for (int i = 1; i < Count + 1; i++)
{
NameList.Add("第" + i.ToString() + "组");
}
}
}
if (LabelList.Count == 0)
{
for (int i = 0; i < Count; i++)
{
LabelList.Add("含义" + i.ToString());
}
}
if (x_step == 0.0)
x_step = 5;
if (y_step == 0.0)
y_step = 5;
}
/**/
///
/// 画图
///
///
///
///
private void zedGraphControl_RenderGraph(ZedGraphWeb zgw, System.Drawing.Graphics g, ZedGraph.MasterPane masterPane)
{
InitProperty();
GraphPane myPane = masterPane[0];
myPane.Title.Text = Title;
myPane.XAxis.Title.Text = XAxisTitle;
myPane.YAxis.Title.Text = YAxisTitle;
//if (true)
//{
// DrawMessage(myPane, "yiafdhaskjhfasfksahfasdlhfaslf lasgfasglgsadi");
// pane.AxisChange(g);
// return;
//}
switch (Type)
{
case AnalyticsType.Line:
DrawLine(myPane);
break;
case AnalyticsType.Bar:
DrawBar(myPane);
break;
case AnalyticsType.Pie:
DrawPie(myPane);
break;
case AnalyticsType.Line2:
DrawLine2(myPane);
break;
case AnalyticsType.Curve:
DrawCurve(myPane);
break;
case AnalyticsType.Curve2:
DrawCurve2(myPane);
break;
default:
break;
}
masterPane.AxisChange(g);
}
#region Draw
/**/
///
/// 画折线图
///
///
private void DrawLine(GraphPane graphPane)
{
for (int i = 0; i < Count; i++)
{
graphPane.AddCurve(NameList[i], DataSource[i], Colors[i], SymbolType.None);
string[] labels = LabelList.ToArray();
graphPane.XAxis.Scale.TextLabels = labels;
graphPane.XAxis.Type = AxisType.Text;
graphPane.Chart.Fill = new Fill(Color.White, Color.FromArgb(255, 255, 166), 90F);
graphPane.Fill = new Fill(Color.FromArgb(250, 250, 255));
graphPane.YAxis.Scale.MajorStep = y_step;
}
}
/**/
///
/// 画折线图,带阴影区域
///
///
private void DrawLine2(GraphPane graphPane)
{
for (int i = 0; i < Count; i++)
{
graphPane.AddCurve(NameList[i], DataSource[i], Colors[i], SymbolType.None).Line.Fill = new Fill(Color.White, Colors[i], 90F);
string[] labels = LabelList.ToArray();
graphPane.XAxis.Scale.TextLabels = labels;
graphPane.XAxis.Type = AxisType.Text;
graphPane.Chart.Fill = new Fill(Color.White, Color.FromArgb(255, 255, 166), 90F);
graphPane.Fill = new Fill(Color.FromArgb(250, 250, 255));
graphPane.YAxis.Scale.MajorStep = y_step;
}
}
/**/
///
/// 画星行折线图
///
///
private void DrawCurve(GraphPane graphPane)
{
for (int i = 0; i < Count; i++)
{
graphPane.AddCurve(NameList[i], DataSource[i], Colors[i], SymbolType.Star);
string[] labels = LabelList.ToArray();
graphPane.XAxis.Scale.TextLabels = labels;
graphPane.XAxis.Type = AxisType.Text;
graphPane.Chart.Fill = new Fill(Color.White, Color.FromArgb(255, 255, 166), 90F);
graphPane.Fill = new Fill(Color.FromArgb(250, 250, 255));
graphPane.YAxis.Scale.MajorStep = y_step;
}
}
/**/
///
/// 画星行折线图,带阴影区域
///
///
private void DrawCurve2(GraphPane graphPane)
{
for (int i = 0; i < Count; i++)
{
graphPane.AddCurve(NameList[i], DataSource[i], Colors[i], SymbolType.Star).Line.Fill = new Fill(Color.White, Colors[i],90F);
string[] labels = LabelList.ToArray();
graphPane.XAxis.Scale.TextLabels = labels;
graphPane.XAxis.Type = AxisType.Text;
graphPane.Chart.Fill = new Fill(Color.White, Color.FromArgb(255, 255, 166), 90F);
graphPane.Fill = new Fill(Color.FromArgb(250, 250, 255));
graphPane.YAxis.Scale.MajorStep = y_step;
}
}
/**/
///
/// 画柱状图
///
///
private void DrawBar(GraphPane graphPane)
{
for (int i = 0; i < Count; i++)
{
graphPane.AddBar(LabelList[i], DataSource[i], Colors[i]).Bar.Fill = new Fill(Colors[i], Color.White, Colors[i]);
//.Line.Fill = new Fill(Color.White, Color.Red, 45F);
//.Line.Fill = new Fill(Color.White, Color.Blue, 45F);
}
graphPane.XAxis.MajorTic.IsBetweenLabels = true;
string[] labels = NameList.ToArray();
graphPane.XAxis.Scale.TextLabels = labels;
graphPane.XAxis.Type = AxisType.Text;
graphPane.Chart.Fill = new Fill(Color.White, Color.FromArgb(255, 255, 166), 90F);
//graphPane.Fill = new Fill(Color.FromArgb(250, 250, 255));
graphPane.Fill = new Fill(Color.White, Color.FromArgb(200, 200, 255), 45.0f);
//graphPane.Chart.Fill = new Fill(Color.White, Color.LightGoldenrodYellow, 45.0f);
graphPane.YAxis.Scale.MajorStep = y_step;
//graphPane.BaseDimension =8;
}
/**/
///
/// 画饼图
///
///
private void DrawPie(GraphPane graphPane)
{
graphPane.Fill = new Fill(Color.White, Color.Silver, 45.0f);
graphPane.Legend.Position = LegendPos.Float;
graphPane.Legend.Location = new Location(0.95f, 0.15f, CoordType.PaneFraction, AlignH.Right, AlignV.Top);
graphPane.Legend.FontSpec.Size = 20f;
graphPane.Legend.IsHStack = false;
for (int i = 0; i < Count; i++)
{
graphPane.AddPieSlice(ScaleData[i], Colors[i], Color.White, 45f, 0, NameList[i]);
}
}
/**/
///
/// 如果系统出错,显示错误信息
///
///
///
private void DrawMessage(GraphPane graphPane, string message)
{
TextObj text = new TextObj(message, 200, 200);
text.Text = message;
graphPane.GraphObjList.Add(text);
}
#endregion
}
最后,注意当画饼图时,有时注释会把图片遮住,这时只要设置图片长和高的比例就可以了。曲线图和直方图的x組的说明文字如果太多的话,就会屏蔽掉一些,这是也只要设置长和高的比例就可以解决问题了。
本文转自 qianshao 51CTO博客,原文链接:http://blog.51cto.com/qianshao/202157,如需转载请自行联系原作者