代码:

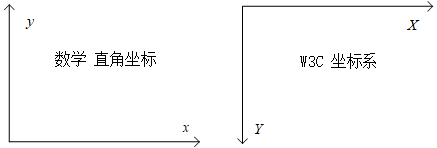
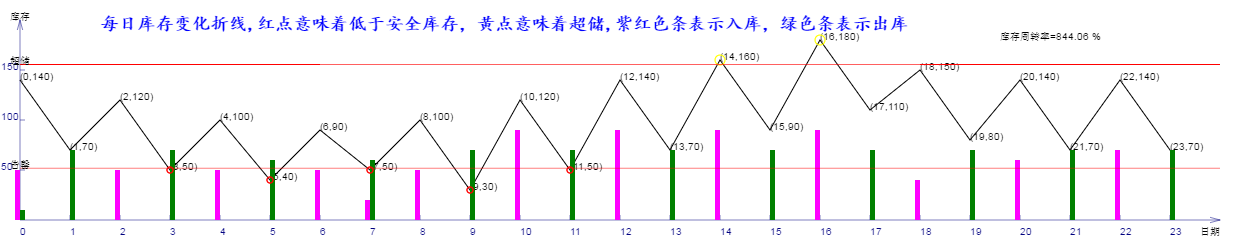
<!DOCTYPE html>
<html lang="utf-8">
<meta http-equiv="Content-Type" content="text/html; charset=utf-8"/>
<head>
     <title>显示入库出库柱状图</title>
    </head>

     <body onload="draw()">
        <canvas id="myCanvus" width="1240px" height="240px" style="border:1px dashed black;">
            出现文字表示你的浏览器不支持HTML5
        </canvas>
     </body>
</html>
<script type="text/javascript">
<!--
function draw(){
    var canvas=document.getElementById("myCanvus");
    var canvasWidth=1240;
    var canvasHeight=240;

    var context=canvas.getContext("2d");

    context.fillStyle = "white";
    context.fillRect(0, 0, canvasWidth, canvasHeight);

    context.strokeStyle = "black";
    context.fillStyle = "black";

    context.save();

    // 进行坐标变换:把原点放在左下角,东方为X轴正向,北方为Y轴正向
    var offset=20;// 偏移值,用来画坐标轴

    context.save();
    context.translate(0+offset,canvasHeight-offset);
    context.rotate(getRad(180));
    context.scale(-1,1);

    drawAxisX(context,canvasWidth-40);
    drawAxisY(context);

    // 出库数据,这是主动数据
    var outbounds=[10,70,0,70,0,60,0,60,0,70,0,70,0,70,0,70,0,70,0,70,0,70,0,70,];
    var daysales=0;// 日销售量
    var sum=0;

    // 日销售量=出库数据均值
    for(var i=0;i<outbounds.length;i++){
        sum+=outbounds[i];
    }
    daysales=sum/outbounds.length;
    console.log("日销售量="+daysales);

    // 零件对象,固有属性数据
    var piece=new Object();
    piece.actualStock=100;// 当前实际库存量,单位个
    piece.leadtime=1;// 到货天数,单位天
    piece.safeday=0.5;// 安全系数,单位天
    piece.supplyGap=2;//供应间隔日数,单位天
    piece.reorganizeDay=2;//整理准备日数,单位天

    // 最低库存量
    var minStorage=daysales*(piece.leadtime+piece.safeday);
    console.log("最低库存量="+minStorage);

    // 最高库存量
    var maxStorage=daysales*(piece.supplyGap+piece.reorganizeDay+piece.safeday);
    console.log("最高库存量="+maxStorage);

    // 入库数据,这是被动数据
    var inbounds=[50,0,50,0,50,0,50,20,50,0,90,0,90,0,90,0,90,0,40,0,60,0,70,0,];


    drawStockCurve(context,piece.actualStock,inbounds,outbounds,minStorage,maxStorage);
    drawBounds(context,minStorage,maxStorage,canvasWidth-40);

    context.restore();


    // 计算库存周转率
    var outTotal=0;// 出库总金额

    // 出库总金额=出库量累计
    for(var i=0;i<outbounds.length;i++){
        outTotal+=outbounds[i];
    }
    console.log("出库总金额="+outTotal);

    // 总库存金额
    var inStock=piece.actualStock;
    sum=0;
    for(var i=0;i<inbounds.length;i++){
        inStock=inStock+inbounds[i]-outbounds[i];
        sum+=inStock;
    }
    console.log("inStock="+inStock);

    var inAvg=sum/inbounds.length;// 平均库存量/平均库存金额
    console.log("平均库存金额="+inAvg);

    var storageRate=outTotal/inAvg*100;
    console.log("库存周转率="+storageRate);

    context.fillText("库存周转率="+toCurrency(""+storageRate+"")+"%",1000,40);

    context.fillText("库存",10,20);
    context.fillText("日期",1200,235);

    context.font="bold 18px 楷体";
    context.fillStyle="blue";
    context.fillText("每日库存变化折线,红点意味着低于安全库存,黄点意味着超储,紫红色条表示入库,绿色条表示出库",100,30);
}

function drawBounds(ctx,minStorage,maxStorage,axisLength){
    ctx.save();

    ctx.lineWidth=0.5;
    ctx.strokeStyle='red';

    // 画underage
    ctx.beginPath();
    ctx.moveTo(0, minStorage);
    ctx.lineTo(axisLength, minStorage);
    ctx.stroke();
    ctx.closePath();

    ctx.save();
    ctx.translate(-10,minStorage);
    ctx.rotate(getRad(180));
    ctx.scale(-1,1);
    ctx.fillText("告罄",0,0);
    ctx.restore();

    ctx.restore();


    ctx.save();

    ctx.lineWidth=0.5;
    ctx.strokeStyle='red';

    // 画underage
    ctx.beginPath();
    ctx.moveTo(0, maxStorage);
    ctx.lineTo(axisLength, maxStorage);
    ctx.stroke();
    ctx.closePath();

    ctx.save();
    ctx.translate(-10,maxStorage);
    ctx.rotate(getRad(180));
    ctx.scale(-1,1);
    ctx.fillText("超储",0,0);
    ctx.restore();

    ctx.restore();
}

function drawStockCurve(ctx,actualStock,inbounds,outbounds,minStorage,maxStorage){
    ctx.save();

    ctx.lineWidth=1;
    ctx.strokeStyle='black';
    ctx.fillStyle='black';

    // 显示折线图
    var y=actualStock;
    var x;

    ctx.beginPath();
    for(var i=0;i<inbounds.length;i++){
        y=y+inbounds[i]-outbounds[i];
        x=i*50;
        ctx.lineTo(x, y);

        ctx.save();
        // 因坐标变换会导致文字错位,故采用位移+旋转+缩放的方式恢复
        ctx.translate(x,y);
        ctx.rotate(getRad(180));
        ctx.scale(-1,1);
        ctx.fillText("("+i+","+y+")",0,0);
        ctx.restore();
    }
    ctx.stroke();
    ctx.closePath();

    // 显示当日出库入库柱状图
    y=actualStock;
    x=0;
    var barWidth=5;

    for(var i=0;i<inbounds.length;i++){
        y=inbounds[i];
        x=i*50;

        ctx.fillStyle = "fuchsia";
        ctx.fillRect(x-barWidth, 0, barWidth, y);

        y=outbounds[i];
        x=i*50;

        ctx.fillStyle = "green";
        ctx.fillRect(x, 0, barWidth, y);
    }


    // 显示超储、告罄标志
    y=actualStock;
    x=0;

    for(var i=0;i<inbounds.length;i++){
        y=y+inbounds[i]-outbounds[i];
        x=i*50;
        ctx.lineTo(x, y);

        if(y>maxStorage){
            ctx.beginPath();
            ctx.strokeStyle='yellow';
            ctx.arc(x,y,5,0,Math.PI*2,false);
            ctx.stroke();
            ctx.closePath();
        }

        if(y<minStorage){
            ctx.beginPath();
            ctx.strokeStyle='red';
            ctx.arc(x,y,3,0,Math.PI*2,false);
            ctx.stroke();
            ctx.closePath();
        }
    }

    ctx.restore();
}

function drawAxisX(ctx,axisLength){
    ctx.save();

    ctx.lineWidth=0.5;
    ctx.strokeStyle='navy';
    ctx.fillStyle='navy';

    // 画轴
    ctx.beginPath();
    ctx.moveTo(0, 0);
    ctx.lineTo(axisLength, 0);
    ctx.stroke();
    ctx.closePath();

    ctx.beginPath();
    ctx.moveTo(axisLength-Math.cos(getRad(15))*10, Math.sin(getRad(15))*10);
    ctx.lineTo(axisLength, 0);
    ctx.lineTo(axisLength-Math.cos(getRad(15))*10, -Math.sin(getRad(15))*10);
    ctx.stroke();
    ctx.closePath();

    // 画刻度
    var x,y;
    y=5;
    for(x=50;x<axisLength;x+=50){
        ctx.beginPath();
        ctx.moveTo(x, 0);
        ctx.lineTo(x, y);

        ctx.stroke();
        ctx.closePath();
    }

    // 写文字
    var i=0;
    for(x=0;x<axisLength;x+=50){
        ctx.save();
        ctx.scale(1,-1);
        ctx.fillText(i,x,y+10);
        ctx.restore();

        i++;
    }

    ctx.restore();
}

function drawAxisY(ctx){
    ctx.save();

    ctx.lineWidth=0.5;
    ctx.strokeStyle='navy';
    ctx.fillStyle='navy';

    // 画轴
    ctx.beginPath();
    ctx.moveTo(0, 0);
    ctx.lineTo(0, 200);
    ctx.stroke();
    ctx.closePath();

    ctx.beginPath();
    ctx.moveTo(Math.sin(getRad(15))*10, 200-Math.cos(getRad(15))*10);
    ctx.lineTo(0, 200);
    ctx.lineTo(-Math.sin(getRad(15))*10, 200-Math.cos(getRad(15))*10);
    ctx.stroke();
    ctx.closePath();

    // 画刻度
    var x,y;
    x=5;
    for(y=50;y<200;y+=50){
        ctx.beginPath();
        ctx.moveTo(x, y);
        ctx.lineTo(0, y);

        ctx.stroke();
        ctx.closePath();
    }

    // 写文字
    x=-19;
    for(y=50;y<200;y+=50){
        ctx.save();

        ctx.scale(1,-1);
        ctx.translate(0,-200);

        ctx.fillText(200-y,x,y);
        ctx.restore();
    }

    ctx.restore();
}

function getRad(degree){
    return degree/180*Math.PI;
}

function toCurrency(money) {
    if (/[^0-9\.]/.test(money)){
        return '0.00';
    }

    money = money.replace(/^(\d*)$/, "$1.");
    money = (money + "00").replace(/(\d*\.\d\d)\d*/, "$1");
    money = money.replace(".", ",");
    var re = /(\d)(\d{3},)/;
    while (re.test(money)) {
        money = money.replace(re, "$1,$2");
    }
    money = money.replace(/,(\d\d)$/, ".$1");

    return '' + money.replace(/^\./, "0.")+" ";
}
//-->
</script>
本文转自张昺华-sky博客园博客,原文链接:http://www.cnblogs.com/xiandedanteng/p/7596156.html,如需转载请自行联系原作者