ORACLE数据库的systemstat dump生成trace文件虽然比较简单,但是怎么从trace文件中浩如烟海的信息中提炼有用信息,并作出分析诊断是一件技术活,下面收集、整理如何分析解读systemstat dump产生的trace文件。
如果要人工去解读systemstat dump生成的trace文件,真是一件体力活,因为这些trace文件动不动就几百M甚至更大,它产生的跟踪文件包含了系统中所有进程的进程状态等信 息。每个进程对应跟踪文件中的一段内容,反映该进程的状态信息,包括进程信息,会话信息,enqueues信息(主要是lock的信息),缓冲区的信息和 该进程在SGA区中持有的(held)对象的状态等信息。dump systemstate产生的跟踪文件是从dump那一刻开始到dump任务完成之间一段事件内的系统内所有进程的信息。 我们需要的是找到导致问题出现的进程的信息,然后根据进程的信息判断导致问题出现的root cause,并在分析问题后解决问题。
幸好网上有人写了这个一个工具ass109.awk ,可以节约分析systemstat dump文件或跟踪文件(trace file)的时间,可以将trace文件中关键信息梳理、整理出来,当然如果了解详细信息,还是必须人工去解读。下面贴上一个例子,是我在学习中的一个案 例,本人也是在学习、研究过程中,如有分析不对的地方敬请指出
[oracle@db-server udump]$ awk -f ass109.awk scm2_ora_25575.trc
Starting Systemstate 1
.................................................
Starting Systemstate 2
....................................................
Starting Systemstate 3
....................................................
Ass.Awk Version 1.0.9 - Processing scm2_ora_25575.trc
System State 1
~~~~~~~~~~~~~~~~
1:
2: waiting for 'pmon timer'
3: waiting for 'rdbms ipc message'
4: waiting for 'rdbms ipc message'
5: waiting for 'rdbms ipc message'
6: waiting for 'rdbms ipc message'
7: waiting for 'rdbms ipc message'
8: last wait for 'smon timer'
9: waiting for 'rdbms ipc message'
10: waiting for 'rdbms ipc message'
11: waiting for 'rdbms ipc message'
12: waiting for 'rdbms ipc message'
13: waiting for 'SQL*Net message from client'[Latch 855675ae0]
Cmd: Select
14: waiting for 'SQL*Net message from client'[Latch 8556759a0]
Cmd: Select
15: waiting for 'SQL*Net message from client'
Cmd: Select
16: waiting for 'SQL*Net message from client'[Latch 855675720]
17: waiting for 'SQL*Net message from client'[Latch 8556755e0]
Cmd: Insert
18: waiting for 'SQL*Net message from client'[Latch 8556755e0]
Cmd: Select
19: waiting for 'SQL*Net message from client'[Latch 8556755e0]
Cmd: Select
20: waiting for 'SQL*Net message from client'[Latch 8556755e0]
Cmd: Select
21: waiting for 'SQL*Net message from client'[Latch 8556755e0]
Cmd: Insert
22: waiting for 'virtual circuit status'
Cmd: Select
23:
24:
25: waiting for 'virtual circuit status'
Cmd: Select
26:
27: waiting for 'virtual circuit status'
Cmd: Select
28:
29: waiting for 'latch: shared pool' [Latch 8556759a0]
Cmd: Select
30:
31: waiting for 'virtual circuit status'
Cmd: Select
33: waiting for 'jobq slave wait'
34:
35:
36: waiting for 'Streams AQ: qmn slave idle wait'
37: waiting for 'rdbms ipc message'
38: waiting for 'rdbms ipc message'
39: waiting for 'rdbms ipc message'
40: waiting for 'rdbms ipc message'
41: waiting for 'rdbms ipc message'
42: waiting for 'rdbms ipc message'
43: waiting for 'rdbms ipc message'
44: waiting for 'rdbms ipc message'
45: waiting for 'rdbms ipc message'
46: waiting for 'rdbms ipc message'
47: waiting for 'Streams AQ: qmn coordinator idle wait'
49: for 'Streams AQ: waiting for time management or cleanup tasks'
58:
61: waiting for 'virtual circuit status'
Cmd: Select
Blockers
~~~~~~~~
Above is a list of all the processes. If they are waiting for a resource
then it will be given in square brackets. Below is a summary of the
waited upon resources, together with the holder of that resource.
Notes:
~~~~~
o A process id of '???' implies that the holder was not found in the
systemstate.
Resource Holder State
Latch 855675ae0 ??? Blocker
Latch 8556759a0 ??? Blocker
Latch 855675720 ??? Blocker
Latch 8556755e0 ??? Blocker
Object Names
~~~~~~~~~~~~
Latch 855675ae0 Child library cache
Latch 8556759a0 Child library cache
Latch 855675720 Child library cache
Latch 8556755e0 Child library cache
System State 2
~~~~~~~~~~~~~~~~
1:
2: waiting for 'pmon timer'
3: waiting for 'rdbms ipc message'
4: waiting for 'rdbms ipc message'
5: waiting for 'rdbms ipc message'
6: waiting for 'rdbms ipc message'
7: waiting for 'rdbms ipc message'
8: waiting for 'smon timer'
9: waiting for 'rdbms ipc message'
10: waiting for 'rdbms ipc message'
11: waiting for 'rdbms ipc message'
12: waiting for 'rdbms ipc message'
13: waiting for 'SQL*Net message from client'[Latch 855675900]
Cmd: Select
14: waiting for 'SQL*Net message from client'[Latch 855675900]
Cmd: Select
15: waiting for 'SQL*Net message from client'[Latch 855675900]
Cmd: Select
16: waiting for 'SQL*Net message from client'[Latch 855675900]
Cmd: Select
17: waiting for 'SQL*Net message from client'[Latch 855675900]
Cmd: Select
18: waiting for 'SQL*Net message from client'[Latch 855675900]
Cmd: Select
19: waiting for 'SQL*Net message from client'[Latch 855675900]
Cmd: Select
20: waiting for 'SQL*Net message from client'[Latch 855675900]
Cmd: Select
21: waiting for 'SQL*Net message from client'[Latch 855675680]
Cmd: Select
22:
23:
24:
25:
26:
27:
28: waiting for 'virtual circuit status'
29:
30:
31: waiting for 'virtual circuit status'
Cmd: Select
32: waiting for 'jobq slave wait'
33: last wait for 'latch: shared pool' [Latch 600f7320]
34:
35: waiting for 'virtual circuit status'
Cmd: Select
36: waiting for 'Streams AQ: qmn slave idle wait'
37: waiting for 'rdbms ipc message'
38: waiting for 'rdbms ipc message'
39: waiting for 'rdbms ipc message'
40: waiting for 'rdbms ipc message'
41: waiting for 'rdbms ipc message'
42: waiting for 'rdbms ipc message'
43: waiting for 'rdbms ipc message'
44: waiting for 'rdbms ipc message'
45: waiting for 'rdbms ipc message'
46: waiting for 'rdbms ipc message'
47: waiting for 'Streams AQ: qmn coordinator idle wait'
48: waiting for 'library cache load lock'
49: for 'Streams AQ: waiting for time management or cleanup tasks'
50: waiting for 'library cache load lock'
58:
61: waiting for 'virtual circuit status'
Cmd: Select
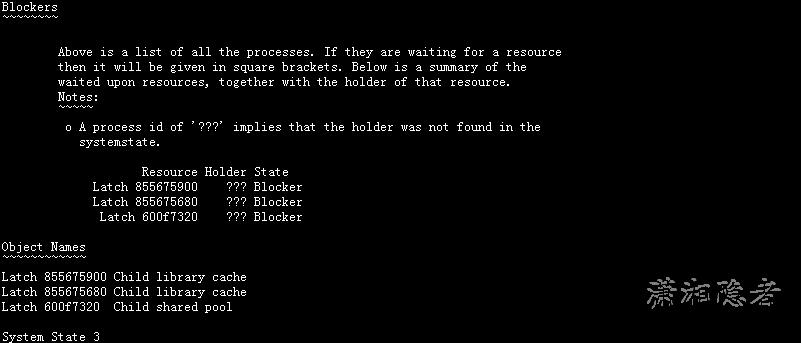
Blockers
~~~~~~~~
Above is a list of all the processes. If they are waiting for a resource
then it will be given in square brackets. Below is a summary of the
waited upon resources, together with the holder of that resource.
Notes:
~~~~~
o A process id of '???' implies that the holder was not found in the
systemstate.
Resource Holder State
Latch 855675900 ??? Blocker
Latch 855675680 ??? Blocker
Latch 600f7320 ??? Blocker
Object Names
~~~~~~~~~~~~
Latch 855675900 Child library cache
Latch 855675680 Child library cache
Latch 600f7320 Child shared pool
System State 3
~~~~~~~~~~~~~~~~
1:
2: waiting for 'pmon timer'
3: waiting for 'rdbms ipc message'
4: waiting for 'rdbms ipc message'
5: waiting for 'rdbms ipc message'
6: waiting for 'rdbms ipc message'
7: waiting for 'rdbms ipc message'
8: waiting for 'smon timer'
9: waiting for 'rdbms ipc message'
10: waiting for 'rdbms ipc message'
11: waiting for 'latch: shared pool' [Latch 600f7320]
12: waiting for 'rdbms ipc message'
13: waiting for 'SQL*Net message from client'[Latch 855675540]
Cmd: Select
14: waiting for 'SQL*Net message from client'[Latch 855675540]
Cmd: Select
15: waiting for 'SQL*Net message from client'[Latch 855675b80]
Cmd: Select
16: waiting for 'SQL*Net message from client'[Latch 8556757c0]
Cmd: Select
17: waiting for 'SQL*Net message from client'[Latch 855675680]
Cmd: Select
18: waiting for 'SQL*Net message from client'[Latch 855675680]
Cmd: Select
19: waiting for 'SQL*Net message from client'[Latch 855675680]
Cmd: Select
20: waiting for 'SQL*Net message from client'
Cmd: Select
21: waiting for 'SQL*Net message from client'[Latch 855675680]
Cmd: Select
22:
23:
24:
25:
26:
27:
28: waiting for 'virtual circuit status'
29:
30:
31: waiting for 'virtual circuit status'
Cmd: Select
32: waiting for 'jobq slave wait'
33: last wait for 'latch: shared pool' [Latch 600f7320]
Cmd: Select
34:
35: waiting for 'virtual circuit status'
Cmd: Select
36: waiting for 'Streams AQ: qmn slave idle wait'
37: waiting for 'rdbms ipc message'
38: waiting for 'rdbms ipc message'
39: waiting for 'rdbms ipc message'
40: waiting for 'rdbms ipc message'
41: waiting for 'rdbms ipc message'
42: waiting for 'rdbms ipc message'
43: waiting for 'rdbms ipc message'
44: waiting for 'rdbms ipc message'
45: waiting for 'rdbms ipc message'
46: waiting for 'rdbms ipc message'
47: waiting for 'Streams AQ: qmn coordinator idle wait'
48: waiting for 'SQL*Net message from client'
49: for 'Streams AQ: waiting for time management or cleanup tasks'
50: waiting for 'latch: shared pool' [Latch 600f7320]
Cmd: Select
58:
61: waiting for 'virtual circuit status'
Cmd: Select
Blockers
~~~~~~~~
Above is a list of all the processes. If they are waiting for a resource
then it will be given in square brackets. Below is a summary of the
waited upon resources, together with the holder of that resource.
Notes:
~~~~~
o A process id of '???' implies that the holder was not found in the
systemstate.
Resource Holder State
Latch 600f7320 ??? Blocker
Latch 855675540 ??? Blocker
Latch 855675b80 ??? Blocker
Latch 8556757c0 ??? Blocker
Latch 855675680 ??? Blocker
Object Names
~~~~~~~~~~~~
Latch 600f7320 Child shared pool
Latch 855675540 Child library cache
Latch 855675b80 Child library cache
Latch 8556757c0 Child library cache
Latch 855675680 Child library cache
从输出信息我们能判断我当时做了3次系统状态转储(实际也是执行了三次oradebug dump systemstate 266),从System State 2,我们可以看到有3个Blocker,我们以其中部分信息做分析
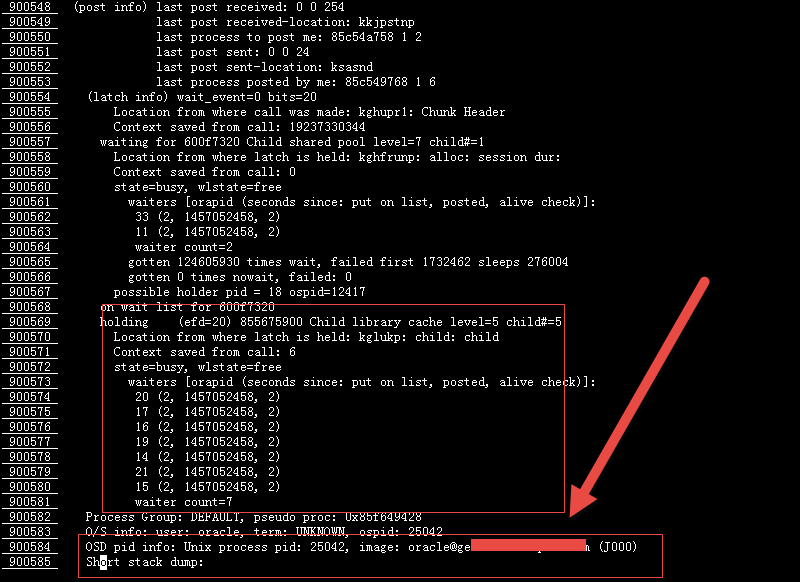
其中的一个Blocker的latch是855675900,而且这个latch造成了进程20、17、16、19、14、21、15的waiting for 'SQL*Net message from client',从下面信息可以看到hold住latch 855675900是oracle@xxxx (J000)进程,也就是job的进程。也就说,由于这个j000进程的异常,hold住了855675900 的latch。
其实这个案例跟“一个Job运行失败导致数据库挂死”有点类似,最后也发现这个JOB是EMD_MAINTENANCE.EXECUTE_EM_DBMS_JOB_PROCS,当然引起问题的原因更复杂,不在此处讨论。另外,metalink上也有一篇关于如何解读、理解Systemstate Dumps的文章: Reading and Understanding Systemstate Dumps (文档 ID 423153.1),具体内容如下所示。
PURPOSE
To be able to read a systemstate, or navigate through a systemstate in order to identify what sessions are doing and ,
in the case of a waiting session, which session(s) hold the resource it requires
SCOPE
This document is intended for DBAs.
DETAILS
Each wait scenario will be given , along with key points in the systemstate which can be used to match to the corresponding entry
in your own systemstates. It will then give you examples of matching holders (ie what you need to find in the rest of the systemstate
to be able to identify who is blocking)
What is a Systemstate ?
A systemstate is made up of the processstate of each process in the instance found at the time the systemstate was called for. Each
processtate is made up of SO (State Objects) which hold details of the state of current objects owned by each PROCESS.
How to Navigate through a systemstate
What you need to do is start by determining what most session are waiting for (or in the case of a session you know
is blocked, the PROCESS number of the process). So - you will now have either a PROCESS XX or a , for example, 'latch free'
which you need to begin with. What you then need to do is navigate (through vi or a windows editor) and find either
PROCESS XX or the first example of 'latch free'. If you are using PROCESS XX then you now need to find what the process
is waiting for. You will now have :-
PROCESS XX waits for YYYYYYY
What you then need to do is find, by using this guide, the SO for the resource the session is waiting for and then find (by
searching back from that point) the PROCESS XX of that session. You now have:-
PROCESS XX waits for YYYYYYY
PROCESS YY holds YYYYYYY
You then begin again, finding the resource it is waiting
for (if any) and that resources holder. Eventually you will come to a process which is on the CPU (last waited) or you will
have navigated back to a PROCESS you already know about. In the case of the process which is on the CPU you will then need
to get an errorstack to determine why it is blocking. In the case of a 'deadlock' you will now have a dependency tree of the form:-
PROCESS XX waits for YYYYYYY
PROCESS YY holds YYYYYYY and waits for ZZZZZZZZ
PROCESS ZZ holds ZZZZZZZ ... etc etc
Common wait scenarios and corresponding Entries
1 - Enqueues
...
waiting for 'enq: TX - row lock contention' blocking sess=0x39b3a5c90 seq=152 wait_time=0 seconds since wait
started=796
name|mode=54580006, usn< 54580006 is split into ASCII 54 + ASCII 58 (TX) + Mode 0006 (X) ...
To find more details on the enqueue, simply do a search for the string 'req:' (searching DOWN)
(enqueue) TX-00020009-0001FA04 DID: 0001-0029-00000090
lv: 00 00 00 00 00 00 00 00 00 00 00 00 00 00 00 00 flag: 0x6
res: 39aef20c8, req: X, prv: 39aef20e8, own: 39b383aa8, sess: 39b383aa8, proc: 39b7384f0
Now you have the enqueue name as a string(TX-00020009-0001FA04) which you can use to search for the HOLDER:-
(enqueue) TX-00020009-0001FA04 DID: 0001-002E-00000014
lv: 00 00 00 00 00 00 00 00 00 00 00 00 00 00 00 00 flag: 0x6
res: 39aef20c8, mode: X, prv: 39aef20d8, own: 39b3a5c90, sess: 39b3a5c90, proc: 39b73ac78
We can see we hold the enqueue (mode:X) in a incompatible mode to the req:X request...
2 - Rowcache locks
PROCESS 19:
...
waiting for 'row cache lock' blocking sess=0x0 seq=2174 wait_time=0
cache id=7, mode=0, request=3 *
We do not hold it currently (mode=0), but want it in Shared (mode=3) ...
--------------------------------------------------------------------------------
SO: 7000000c6de7678, type: 48, owner: 7000000a6c97cf8, flag: INIT/-/-/0x00
row cache enqueue: count=1 session=7000000a660b8b0 object=7000000eedc13a0, request=S*Here we see the request is Shared(S)
savepoint=2148
row cache parent object: address=7000000eedc13a0 cid=7(dc_users)* dc_users is the cache type indicated by 7
hash=2a057ebe typ=9 transaction=7000000c42297a0 flags=00000002
own=7000000eedc1480[7000000c6de8518,7000000c6de8518] wat=7000000eedc1490[7000000c6de7568,7000000c6deed98] mode=X *The holder has it in this mode
status=VALID/-/-/-/-/-/-/-/-
request=N release=TRUE flags=0
To find the HOLDER, search for object,MODE of holder ( ie object=7000000eedc13a0, mode=X):-
row cache enqueue: count=1 session=7000000a6702710 object=7000000eedc13a0, mode=X*This confirms the Mode we thought the holder had (X)
savepoint=109
row cache parent object: address=7000000eedc13a0 cid=7(dc_users)
hash=2a057ebe typ=9 transaction=7000000c42297a0 flags=00000002
own=7000000eedc1480[7000000c6de8518,7000000c6de8518] wat=7000000eedc1490[7000000c6de7568,7000000c6df1b08] mode=X
status=VALID/-/-/-/-/-/-/-/-
request=N release=TRUE flags=0
instance lock id=QH 00000440 00000000
set=0, complete=FALSE
set=1, complete=FALSE
set=2, complete=FALSE
data=
3 - Library Cache Pins (10G - Mutexes)
waiting for 'cursor: pin S wait on X' blocking sess=0x0 seq=58849 wait_time=0 seconds since wait started=0
idn=535d1a6c, value=c1600000000, where|sleeps=5003f2428
To find more details use the idn=XXXXXX to search down in the systemstate (ie idn=535d1a6c)
KGX Atomic Operation Log 7000002e5b9d160
Mutex 7000002b8e92268(3094, 0) idn 535d1a6c oper GET_SHRD *We can see (a) That SID 3094 holds it (3094,0) and (b) we want it in Shared (GET_SHRD)
Cursor Pin uid 2489 efd 0 whr 5 slp 58733
opr=2 pso=70000028c47def0 flg=0
pcs=7000002b8e92268 nxt=0 flg=34 cld=3 hd=70000030d6c6eb0 par=7000002eefe64d0
ct=31 hsh=0 unp=0 unn=0 hvl=b825a4d0 nhv=1 ses=700000309b42600
hep=7000002b8e922e8 flg=80 ld=1 ob=7000002de49f8a0 ptr=70000022cf39db8 fex=70000022cf390c8
To find the HOLDER, search for idn XXXXXXX oper until you find one which is held (ie not GET_XXX)( ie idn 535d1a6c oper):-
Mutex 7000002b8e92268(3094, 0) idn 535d1a6c oper EXCL *We can see SID 3094 holds in Exclusive (EXCL)
Cursor Pin uid 3094 efd 0 whr 7 slp 0
opr=3 pso=7000002a71c4180 flg=0
pcs=7000002b8e92268 nxt=0 flg=34 cld=3 hd=70000030d6c6eb0 par=7000002eefe64d0
ct=31 hsh=0 unp=0 unn=0 hvl=b825a4d0 nhv=1 ses=700000309b42600
hep=7000002b8e922e8 flg=80 ld=1 ob=7000002de49f8a0 ptr=70000022cf39db8 fex=70000022cf390c8
4 - Library Cache Pins (Pre 10G - non mutex)
waiting for 'library cache pin' blocking sess=0x0 seq=575 wait_time=0
handle address=c00000006c0f8490, pin address=c0000000689b19a8, 10*mode+namespace=14
To find more details use the handle=XXXXXX to search down in the systemstate (ie handle=c00000006c0f8490) and you will see a 'request' line
SO: c0000000689b19a8, type: 34, owner: c00000006cf85e80, flag: INIT/-/-/0x00
LIBRARY OBJECT PIN: pin=c0000000689b19a8 handle=c00000006c0f8490 request=S lock=c00000006d00e218 *We can see we want it in Shared (S)
user=c00000005eeafeb0 session=c00000005eeafeb0 count=0 mask=0000 savepoint=17 flags=[00]
To find the HOLDER, search for 'handle=XXXXXXXXX mode' oper until you find one which is held in an incompatible mode( ie handle=c00000006c0f8490 mode):-
LIBRARY OBJECT PIN: pin=c00000006b1f4780 handle=c00000006c0f8490 mode=X lock=c00000006b6c40a0 *We hold it in Exclusive (X)
user=c00000005edf0f48 session=c00000005edf0f48 count=1 mask=0001 savepoint=49 flags=[00]
5 - Library Cache Lock
PROCESS 35:
waiting for 'library cache lock' blocking sess=0x0 seq=35844 wait_time=0 seconds since wait started=14615
handle address=70000030de975a8, lock address=70000026947e190, 100*mode+namespace=12d
To find more details use the handle address in the form handle=address to search down in the systemstate (ie handle=70000030de975a8)
LIBRARY OBJECT LOCK: lock=70000026947e190 handle=70000030de975a8 request=X *We want it in Exclusive (X)
call pin=0 session pin=0 hpc=0000 hlc=0000
htl=70000026947e210[7000002b333ffe8,7000002b333ffe8] htb=7000002b333ffe8 ssga=7000002b333f2a0
user=700000307a7ca68 session=700000307a7ca68 count=0 flags=[0000] savepoint=0x23e411
LIBRARY OBJECT HANDLE: handle=70000030de975a8 mtx=70000030de976d8(0) cdp=0
name=ACSELP.POLIZA *This is the object we are trying to lock
To find the HOLDER, search for 'handle=XXXXXXXXXX mode=' until you find one which is held (but not in NULL)( ie handle=70000030de975a8 mode=):-
SO: 700000288b03ae0, type: 53, owner: 7000002cc697468, flag: INIT/-/-/0x00
LIBRARY OBJECT LOCK: lock=700000288b03ae0 handle=70000030de975a8 mode=S *We hold in in Shared (S)
call pin=0 session pin=0 hpc=0000 hlc=0000
htl=700000288b03b60[7000002a179a1a8,7000002b3800878] htb=7000002b3800878 ssga=7000002b37ffb30
user=70000030fafab00 session=70000030fafab00 count=1 flags=[0000] savepoint=0x417
LIBRARY OBJECT HANDLE: handle=70000030de975a8 mtx=70000030de976d8(0) cdp=0
name=ACSELP.POLIZA *This confirms the object
6 - Latch free
waiting for 'latch free' blocking sess=0x0 seq=4577 wait_time=0
address=99ff60018, number=9d, tries=0 *9d is the latch# from v$latchname in HEX
If you look towards the top of the PROCESS dump you will see the exact latch we are waiting for and even who holds it:
waiting for 99ff60018 Child library cache level=5 child#=3
Location from where latch is held: kglic: child
Context saved from call: 26
state=busy
possible holder pid = 127 ospid=23086 *This tell us PROCESS 127 (ospid:23086) holds it
wtr=99ff60018, next waiter 9993858b8
So - PROCESS 127 holds it. If we now go to PROCESS 127 we will see :-
Location from where latch is held: kglic: child
Context saved from call: 26
state=busy
Other useful information
If you wish to find what object a handle refers to then use the handle=XXXXXXXXXX until you come across the LIBRARY OBJECT HANDLE. ie handle=c00000006c0f8490:-
name=SELECT USER FROM DUAL *This is the name of the handle
hash=cd1ceca0 timestamp=03-23-2007 09:00:00
namespace=CRSR flags=RON/TIM/PN0/SML/[12010000]*It is a CURSOR (CRSR).. but we can tell that by the name!
另外如果要理解、解读systemstate dump的内容,如何阅读systemstate dump这篇文章不得不细读。这个里面讲述了很多Detail方面的东西。非常受益!


