【OS】NMON的简介和使用
目前NMON已开源,以sourceforge为根据地,网址是http://nmon.sourceforge.net。
1. 目的
本文介绍操作系统监控工具Nmon的概念、使用方式及使用参数。指导运维人员通过nmon工具监视AIX/Linux操作系统资源使用情况,收集监控结果及产生的数据文件,制作相关系统性能分析报告。
2. Nmon简介
Nmon (Nigel’s Monitor)是由IBM 提供、免费监控 AIX 系统与 Linux 系统资源的工具。该工具可将服务器系统资源耗用情况收集起来并输出一个特定的文件,并可利用 excel 分析工具(nmon analyser)进行数据的统计分析。
2.1 软件特性
nmon 工具可以在一个屏幕上显示所有重要的性能优化信息,并动态地对其进行更新。这个高效的工具可以工作于任何哑屏幕、telnet 会话、甚至拨号线路。另外,它不会消耗大量的 CPU 周期,通常低于百分之二(在更新的计算机上,其 CPU 使用率将低于百分之一)。nmon使用哑屏幕,在屏幕上对数据进行显示,并且每隔两秒钟对其进行更新。用户可以很容易地将这个时间间隔更改为更长或更短的时间段。如果拉伸窗口,并在 X Windows、VNC、PuTTY 或类似的窗口中显示这些数据,nmon 工具可以同时输出大量的信息。
nmon 工具还可以将相同的数据捕获到一个文本文件,便于以后对报告进行分析和绘制图形。输出文件采用电子表格的格式 (.csv)。
目前nmon已开源,以sourceforge为根据地,网址是http://nmon.sourceforge.net。
2.2 软件组成
Nmon使用需要nmon工具和nmonanalyser分析程序两者配合使用。nmon工具生成性能数据文件,然后monanalyser以nmon生成的数据文件作为输入,输出为Excel 电子表格,并自动地生成相应的图形,使得我们能够直观地观察OS性能(CPU、IO和内存等)的变化过程。
2.3 运行环境
nmon 工具运行于:
· AIX? 4.1.5、4.2.0、4.3.2 和 4.3.3(nmon Version 9a:该版本的功能已经确定,并且不会对其进行进一步的开发。)
· AIX 5.1、5.2 和 5.3(nmon Version 10:该版本现在支持 AIX 5.3 和基于 POWER5? 处理器的计算机,并且提供了 SMT 和共享 CPU 微分区的支持。)
· pSeries? p5 和 OpenPower? 上的 Linux? SUSE SLES 9、Red Hat EL 3 和 4、Debian
· Linux SUSE、Red Hat 和许多最新的 x86(32 位模式的 Intel 和 AMD)上的发布版
· zSeries? 或 mainframe 上的 Linux SUSE 和 Red Hat
nmon 工具大约每六个月更新一次,或者在可用的新的操作系统发布版中对其进行更新。
2.4 软件功能
nmon 工具可以为 AIX 和 Linux 性能专家提供监视和分析性能数据的功能,其中包括:
· CPU 使用率
· 内存使用情况
· 内核统计信息和运行队列信息
· 磁盘 I/O 速度、传输和读/写比率
· 文件系统中的可用空间
· 磁盘适配器
· 网络 I/O 速度、传输和读/写比率
· 页面空间和页面速度
· CPU 和 AIX 规范
· 消耗资源最多的进程
· IBM HTTP Web 缓存
· 用户自定义的磁盘组
· 计算机详细信息和资源
· 异步 I/O,仅适用于 AIX
· 工作负载管理器 (WLM),仅适用于 AIX
· IBM TotalStorage? Enterprise Storage Server? (ESS) 磁盘,仅适用于 AIX
· 网络文件系统 (NFS)
· 动态 LPAR (DLPAR) 更改,仅适用于面向 AIX 或 Linux 的 pSeries p5 和 OpenPower
2.5 软件获取
nmon工具和nmonanalyser工具都可以在IBM的Wike页面上下载到。
1) Nmon下载:
位置:可从IBM Wiki上下载
http://www-941.haw.ibm.com/collaboration/wiki/display/WikiPtype/nmon
下载页面如下: ![]()

例如测试的系统是AIX5.3,那么就可以下载nmon4aix12e.zip ,下载后可以看到压缩包里是一些文件,如下: ![]()

其实nmon就是shell脚本,nmon文件运行时调用其他的文件,生成性能数据,这个工具运行时也是通过执行nmon脚本接受参数。
2) Nmonanalyser下载:
位置:可从可从IBM Wiki上下载
http://www-941.haw.ibm.com/collaboration/wiki/display/Wikiptype/nmonanalyser
下载页面如下: ![]()

例如下载V3.3版本的Nmonanalyser。
3. Nmon使用
3.1 下载软件
1) 下载之前须确定操作系统内核版本,本文以公司服务器192.168.40.212为例。登录服务器使用命令获取操作系统版本信息:

查看可知为Enterprise Linux Server release 5.5。
2) 登录IBM官方网站(http://nmon.sourceforge.net/pmwiki.php?n=Site.Download)下载相应版本的nmon工具:nmon_linux_14g.tar.gz
3.2 安装软件
1) 用root用户登录系统,建立目录:#mkdir /nmon
2) 通过FTP将下载的nmon工具上传至服务器 192.168.40.212目录/nmon下。
3) 修改tar包权限:#chmod +x nmon_linux_14g.tar.gz
4) 解压文件:#tar xvfZ nmon_linux_14g.tar.gz
5) 执行授权命令:#chmod +x nmon_x86_rhel54
3.3 运行界面
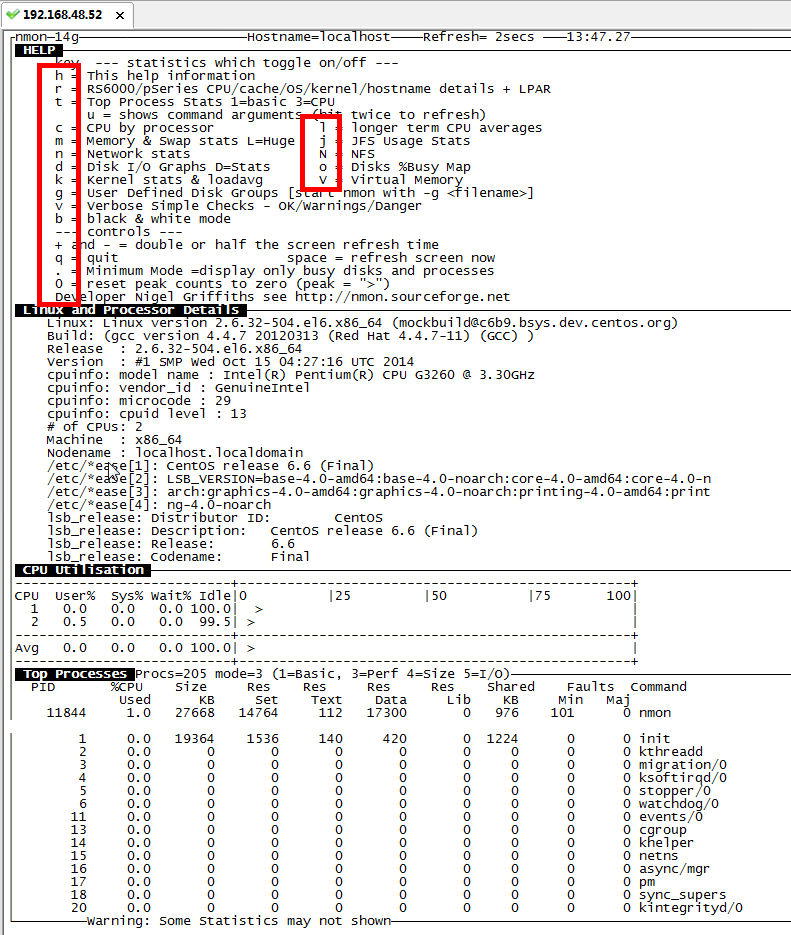
1) 运行./nmon_x86_rhel54,便可进入nmon的监控界面,如下图:

2) 键入“c”查看系统CPU使用情况

3) 键入“m”查看系统内存使用情况

4) 键入“d”查看系统磁盘I/O情况

5) 键入“h”查看帮助信息

3.4 使用方法
3.4.1 实时监控
在完成配置后,只需要“#./nmon”命令即可运行程序,通过一些快捷键调取关心的系统资源指标进行显示,如按键“C”可以查看CPU相 关信息;按键“D”可以查看磁盘信息;按键“T”可以查看系统的进程信息;“M”对应内存、“N”对应网络等等,完整的快捷键对应内容可以通过帮助(按键 “H”)查看,可以显示Linux系统CPU、内存、进程信息,包括了CPU的用户、系统、等待和空闲状态值,可用内存、缓存大小以及进程的CPU消耗等详细指标。
该种方式显示信息实时性强,能够及时掌握系统承受压力下的运行情况,每颗CPU利用率是多少、内存使用多少、网络流量多少、磁盘读写……这些数据均是实时刷新,一目了然。
3.4.2 后台监控
为了配合性能测试,我们往往需要将一个时间段内系统资源消耗情况记录下来,这时可以使用命令在远程窗口执行命令:
./nmon/ nmon_x86_rhel5 -f -N -m /nmon/log -s 30 -c 120
其中各参数表示:
-f 按标准格式输出文件:<hostname>_YYYYMMDD_HHMM.nmon
-N include NFS sections
-m 切换到路径去保存日志文件
-s 每隔n秒抽样一次,这里为30
-c 取出多少个抽样数量,这里为120,即监控=120*(30/60/60)=1小时
根据小时计算这个数字的公式为:c=h*3600/s,比如要监控10小时,每隔30秒采样一次,则c=10*3600/30=1200
该命令启动后,会在nmon所在目录下生成监控文件,并持续写入资源数据,直至360个监控点收集完成——即监控1小时,这些操作均自动完成,无需手工干 预,测试人员可以继续完成其他操作。如果想停止该监控,需要通过“#ps –ef|grep nmon”查询进程号,然后杀掉该进程以停止监控。
3.4.3 定时任务
除配合性能测试的短期监控,我们也可以实现对系统的定期监控,作为运营维护阶段的参考。定期监控实现如下:
1) 执行命令:#crontab –e
2) 在最后一行添加如下命令:
0 8 * * 1,2,3,4,5 /nmon/nmon_x86_rhel5 -f -N -m /nmon/log -s 30 -c 1200
表示:
周一到周五,从早上08点开始,监控10个小时(到18:00整为止),输出到/nmon/log
4. Nmon监控结果介绍
4.1 生成结果文件
通过后台监控和定期监控,我们可以得到扩展名为nmon的监控文件,这些文件记录着系统资源的数据,需要配合分析工具(nmon analyser)进行解读。
1) 使用FTP工具从服务器上取下生成结果文件/nmon/log/sjfx212_120318_1723.nmon到本机。
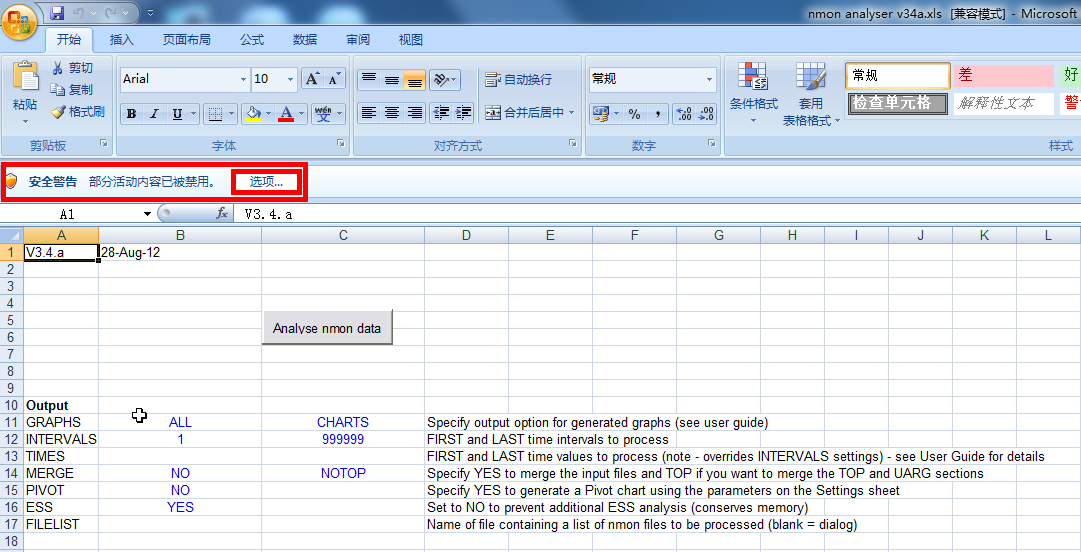
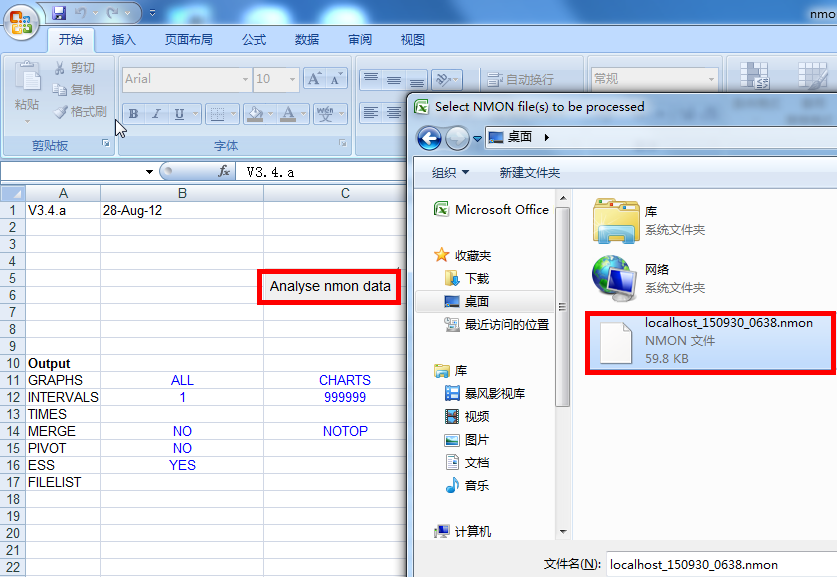
2) 打开nmon_analyser.zip 包下的nmon analyser v33g.xls 文件,点击Analyse nomn data按钮,选择之前get下来的sjfx212_120318_1723.nmon文件。
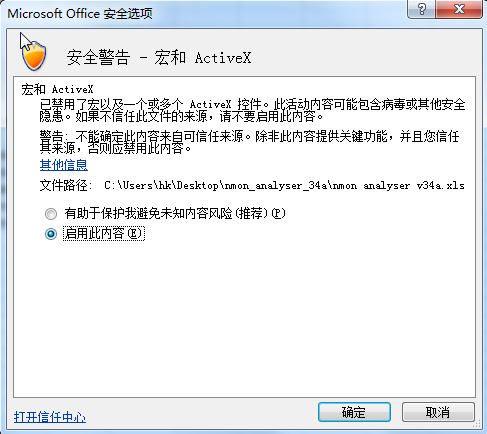
 Excel可能禁止运行宏了,点“安全警告旁边的选项”,允许运行宏:

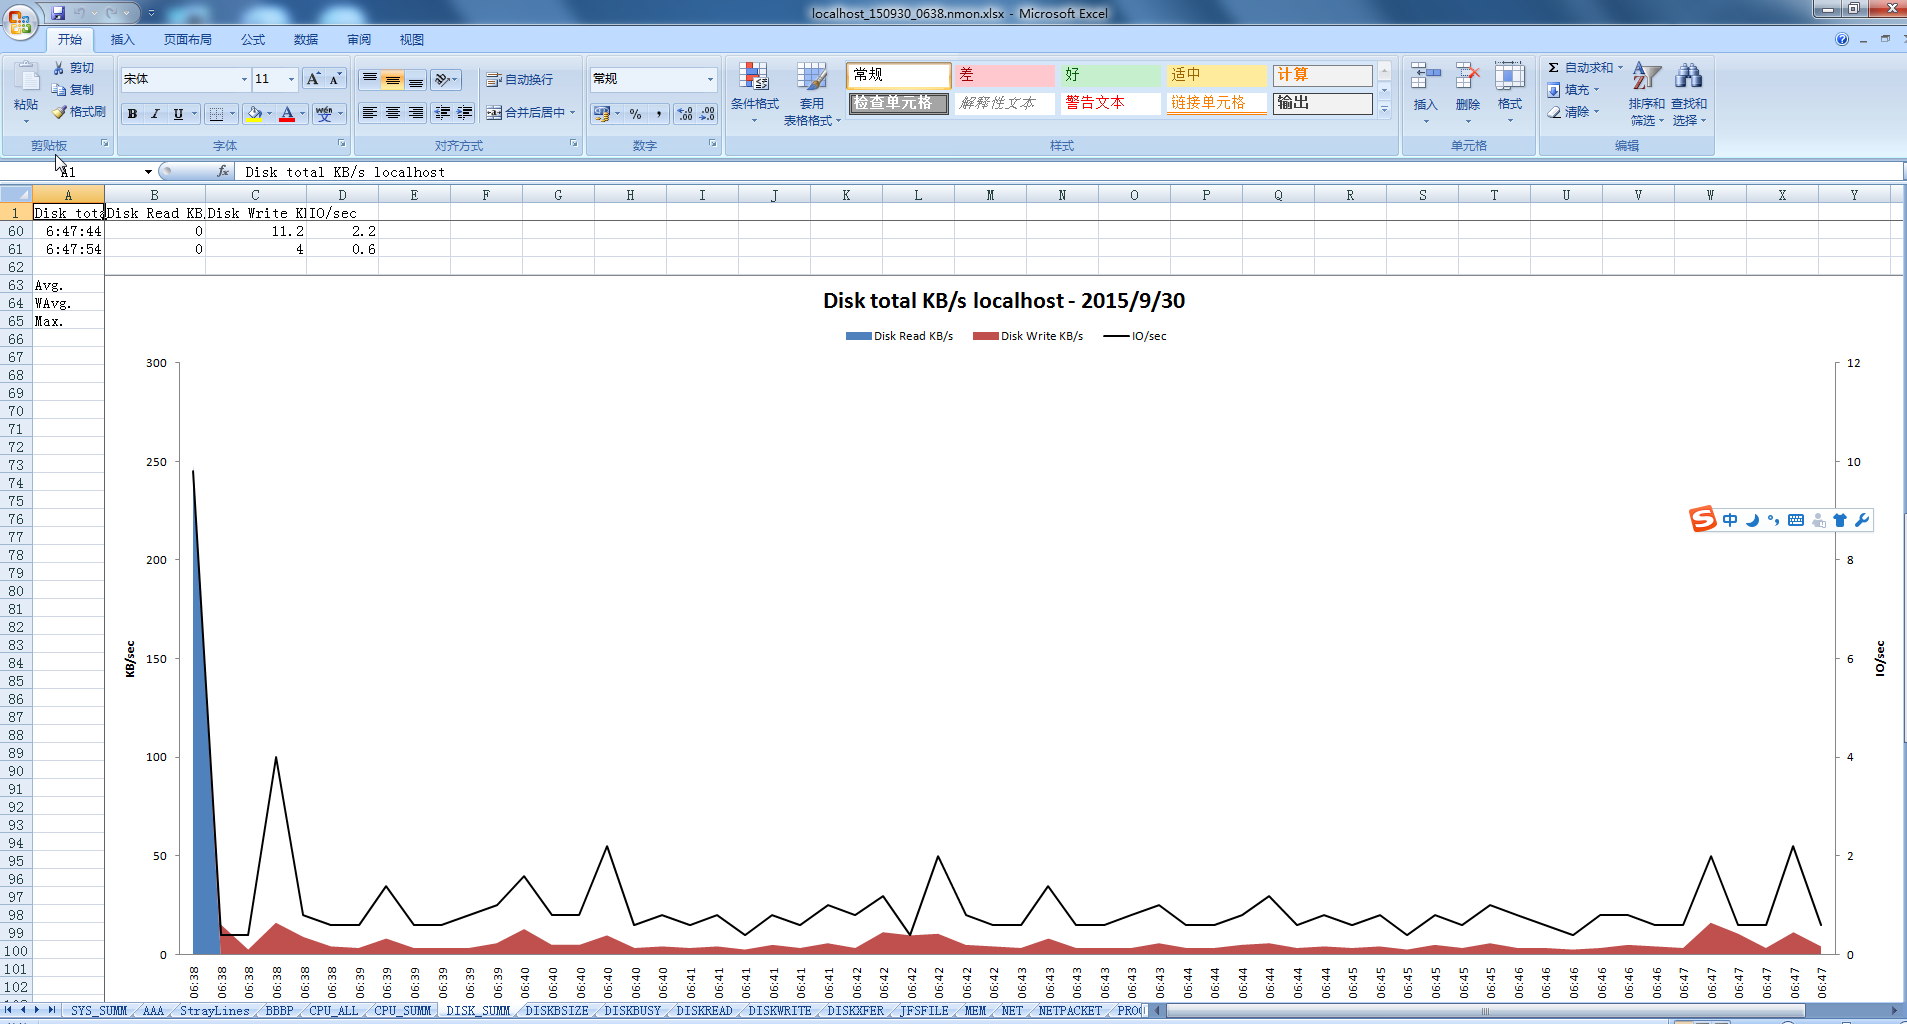
3) 生成分析结果文件sjfx212_120318_1723.nmon.xlsx,并生成统计图,直观显示系统资源情况。

4.2 主要性能参数介绍
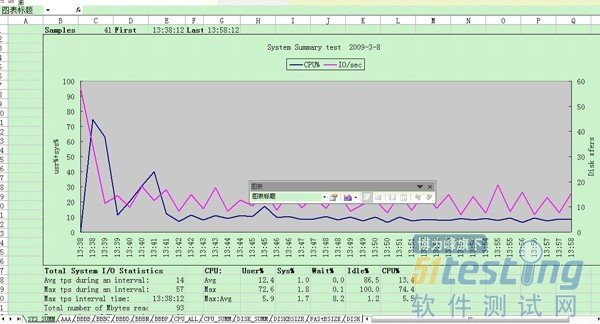
u 系统汇总(对应excel标签的‘SYS_SUMM’):其中蓝线为cpu占有率变化情况;粉线为磁盘IO的变化情况。
u 磁盘读写情况汇总(对应excel标签的‘DISK_SUMM’): 其中蓝色为磁盘读的速率KB/sec;紫色为磁盘写的速率KB/sec。
u 内存情况汇总(对应excel标签的‘MEM’): 曲线表示内存剩余量(MB)
4.3 页面介绍
简单介绍生成结果的各个页面:
1) 系统汇总页面:对应标签页(SYS_SUMM)
页面显示项主要有主机名,执行日期,系统cpu使用情况(蓝线),系统I/O情况(粉红线),其中坐标左纵轴为系统cpu(user%+sys%)使用率,横轴为运行时长(下图为一个小时),右纵轴为系统磁盘传输(Disk xfers),坐标下侧为统计信息:系统I/O情况(一个周期内的平均值、最大值、出现最大值的时间),系统CPU使用情况。
| 选项 |
说明 |
备注 |
| User% |
用户进程时间在CPU 开销时间百分比 |
如果一个CPU 被充分使用,利用率分类之间均衡的比例应该是: 65% - 70% User Time 30% - 35% System Time 0% - 5% Idle Time |
| Wait% |
所有进程线程被阻塞等待完成一次IO 请求所占CPU 开销idle的时间百分比 |
|
| Sys% |
线程和中断在CPU 开销时间百分比 |
|
| Idle% |
CPU 空闲时间的百分比 |
|
| CPU% |
CPU 利用率的百分比 |

注释:
如果系统CPU有IO wait存在,说明可能IO或内存方面存在瓶颈,其中主要导致IO Wait的主要原因如下:
ü 内存不够而引起频繁的的数据交换,导致数据存取存在交换空间的 I/O瓶颈
ü 硬盘数据分布不合理
2) 系统信息:标签页(AAA)
页面信息主要包括:执行命令,主机CPU数(4),操作系统内核版本信息,主机名等信息。

3) 系统详细信息:标签页(BBBP)
页面信息主要包括:操作系统版本,主机磁盘信息,主机CPU型号、主频信息,内存信息,网卡信息等。

4) CPU使用情况:标签页(CPU_ALL,CPU_SUMM,CPU001,CPU002,CPU003,CPU004)
主机CPU使用情况汇总以及单颗CPU的运行情况。


5) 磁盘读写情况汇总:标签页(DISK_SUMM,DISKBSIZE,DISKBUSY,DISKREAD,DISKWRITE,DISKXFER)
磁盘的读、写及I/O统计信息,系统各磁盘分区的读写情况。其中DISKBUSY页主要反映系统本地磁盘使用,DISK_SUMM包括本地和存储(ESS, EMC, FASt及HDS)上所有磁盘使用情况。


6) 内存使用情况:标签页(MEM)
系统内存空闲、使用,swap、cached等统计信息。

7) 系统网络情况:标签页(NET,NETPACKET)
反映系统的网络运行情况,系统各个网络适配器读写的数据包数

8) 系统进程:标签页(PROC)
反映系统运行线程及等待切换的线程平均数。其中RunQueue - 每个处理器应该运行队列不超过1-3个线程。


9) 活动虚拟内存总量:标签页(VM)
Linux操作系统特有指标,主要包括系统/proc/vmstat文件中信息,两张图片主要显示系统分页文件(pagefile)和swap分区运行情况。如果系统总是存在大量换出页(pgpgout/s)KB数,说明系统需要更多内存。


10) 页式调度:标签页(PAGE)
记录系统(AIX)页式调度的情况。这一栏主要记录系统换页(paging)情况和页面扫描:自由比率(page scan:free ratio)。其中系统换页频率应该不大于5次/秒,而当页面扫描:自由比率持续大于4时,需要重点关注下系统内存和分页空间的使用情况。


说明:
大量的内存交换操作会极大地影响系统的性能,尤其是在当数据库文件创建在文件系统上时(JFS and JFS2)。在这种情况下经常访问的数据,即在SGA中存在,也同样在文件的缓存中存在。这种相同的数据在内存中缓存两次的情况,会降低内存的使用效率,从而使内存频繁进行交换操作,造成系统的I/O瓶颈,降低整个系统的性能。
11) 采集时间:标签页(ZZZZ)
记录nmon工具采集系统信息的时间点。

5. Nmon监控案例介绍
本节介绍通过nmon工具发现系统性能下降问题的常见现象和处理流程。
5.1 常见现象和产生原因
性能下降(Performance Degradation),主要是指系统的性能随时间而逐渐下降(这里假定在系统性能下降的过程中系统的负载状况没有明显变化)。系统运行过程中占用的CPU或内存随时间增加也属于广义的性能下降问题。
在生产环境中,通常由终端客户最先感觉到并报告性能下降问题。所以狭义的性能下降问题主要是指系统运行指标随时间变化,比如吞吐率随时间下降或页面响应时间随时间上升,或者两者兼而有之。
下面列举一些引起性能下降问题的原因:
ü 应用程序资源使用问题。主要是内存使用问题,即由于应用服务器的内存碎片问题或内存泄漏问题,导致垃圾回收的开销随时间增大。也有可能是因为磁盘临时文件积累造成磁盘访问开销增大。
ü 应用程序设计问题。由于应用程序的设计存在可扩展性或可靠性问题,导致运行开销随时间或业务对象的积累而增大。
ü 数据库访问问题。该问题又可以分为许多类型,如调优参数问题、表结构或索引设计问题、垃圾数据问题等。其共同特点是导致应用程序利用特定操作访问数据库的开销随时间而增大。
ü 服务器软件资源使用问题。虽然可能性很小,但是应用服务器、数据库服务器等服务器程序也是软件程序,也有可能存在性能下降问题。这些服务器程序在自身测试过程中可能遗漏了某些性能问题,而在用户特定的执行状况下触发了这些问题,结果导致这些服务器程序使用的操作系统资源泄漏而出现性能下降问题。
ü 测试用例设计问题。性能测试中有可能发现一些“假”的性能下降问题。比如测试用例设计时假设在测试执行过程中系统负载保持恒定,但实际的测试用例实现导致系统负载或特定页面的处理内容随时间增多,也可能导致测试工具的测试报告中出现性能下降问题。
5.2 实例介绍
5.2.1 示例一

图5-1 nmon操作系统监视汇总信息图
由此信息图可发现在12小时测试进行过程中,系统的磁盘传输(Disk xfers)逐渐增大,与此同时系统CPU占用率逐渐下降。进一步检查单个CPU的使用情况,发现1号CPU的Wait状态占用率明显增大,如图5-2所示。这说明CPU占用率逐渐下降是由于等待磁盘I/O引起的。

图5-2 nmon单个CPU使用情况图
接下来分析磁盘传输汇总信息,如图5-3所示,可以看出磁盘写数据量没有明显增加,但是磁盘读数据量明显随时间而增加。

图5-3 nmon磁盘传输汇总情况图
凭磁盘传输汇总信息,在排除由应用服务器读取导致的性能下降问题后,基本可以肯定不断增加的磁盘读取操作是由数据库引起的。
随后,分析DB2的快照监视器的监视结果,可以发现DB2的缓冲池(Buffer pool)的数据和索引物理读(physical read)的比例非常高。如下例所示:
Buffer pool data logical reads = 5502388
Buffer pool data physical reads = 430671
Buffer pool temporary data logical reads = 0
Buffer pool temporary data physical reads = 0
……
可以看到缓冲池的物理读比例(即缓冲池不命中率)高达7%,这远远大于1%的警戒线。而且物理读比例有随时间增加的趋势(通过不同时间的快照信息对比发现)。
至此可以怀疑性能下降问题是由于DB2的缓冲池配置参数设置不当引起的。考察数据库配置参数信息发现,该数据库的BUFFPAGE参数值为10000。与该测试用例使用的数据规模相比,这个参数值明显偏小。于是将BUFFPAGE参数值增大10倍,变为100000,重新运行性能测试,发现性能下降问题基本消失。
5.2.2 示例二
本实例为通过nmon监控河北税源管理平台数据仓库收集的数据。对照nmonanalyser工具生成结果进行分析。

1) 收集服务器基本信息


通过以上数据可以知道河北数据仓库服务器基本配置信息如下:
ü 主机名:HE_SSGLY_DB_01
ü 操作系统版本:AIX 5.3.0.44 build 5300-04
ü 操作系统内核:HW-type=CHRP=Common H/W Reference Platform Bus=PCI LPAR=Dynamic Multi-Processor 64 bit
ü 主机型号:IBM p5 595 (9119-595)
ü 网络配置:IP Address: 75.16.16.191 Sub Netmask: 255.255.248.0 Gateway: 75.16.16.100
ü 主机存储:EMC存储
ü 主机物理内存:49152 MB
ü 网卡信息:2块网卡 速率为1024M/S
2) 文件系统使用情况


通过以上数据可以知道河北数据仓库服务器文件系统相关信息如下:
ü 文件系统分区大小及使用情况
ü 文件系统挂载点信息
ü 文件系统类型为JFS2(Journaled File System 2)文件系统
3) 系统资源使用情况

观察上图,可以发现服务器cpu使用率较高的时段为8:00-11:30、14:00-17:20,而系统I/O开销较高的时段均出现在21:00-次日5:50。以上信息基本符合服务器晚上进行数据ETL处理、白天工作时段多进行平台一般事务处理的情况。进一步观察服务器cpu使用情况:


发现CPU利用率较高均为用户进程,单独查看CPU-11注意到22:00-0:00这个时段内CPU的Wait状态占用率明显增大, user状态占用率却很低,此时系统I/O明显升高,说明这个时段内有大量磁盘I/O发生,CPU占用率逐渐下降是由于等待磁盘I/O引起的。实际情况中,这个时段服务器正在进行ETL数据处理,的确有大量数据传输和磁盘读写发生。

5.2.3 示例三
介绍个利用nmon进行系统实时监控的例子。
把nmon脚本上传到服务中,直接运行即可,执行命令如下:#./nmon或者#/tmp/nmon/nmon
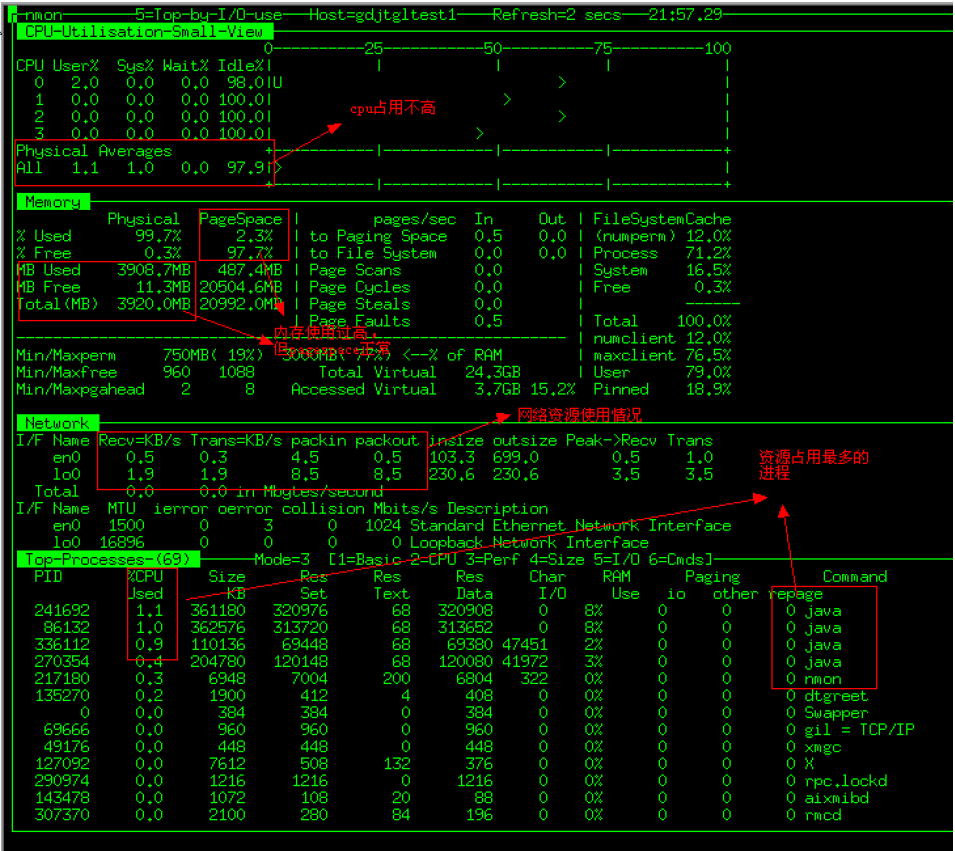
以下是aix5.3下使用nmon的一些截图:

分别输入c、t、n、m,可以了解系统cpu,内存,消耗资源最高的线程的使用情况。 

Links:
NMON home page
http://www-941.haw.ibm.com/collaboration/wiki/display/Wikiptype/nmon
NMON_Analyser home page
http://www-941.haw.ibm.com/collaboration/wiki/display/Wikiptype/nmonanalyser
User Forum
http://www.ibm.com/developerworks/forums/dw_forum.jsp?forum=749&cat=56
一.nmon工具介绍
nmon 是一个分析aix和linux性能的免费工具(主要是ibm为自己的aix操作系统开发的,但是也可以用在linux操作系统),而nmon_analyser是nmon的一个工具可以把nmon生成的报告转化成excel报表的形式供查看
nmon 工具可以在一个屏幕上显示所有重要的性能优化信息,并动态地对其进行更新。它并不会消耗大量的 CPU ,通常低于百分之二
下载地址:
http://nmon.sourceforge.net/pmwiki.php?n=Site.Download
http://sourceforge.net/projects/nmon/files/?source=navbar
注意选择和自己机器对应的版本:
linux查看系统版本号:
1.方法1
对于linux系统而已,有成百上千个发行版。对于发行版的版本号查看方法
如以centos为例。输入lsb_release -a即可
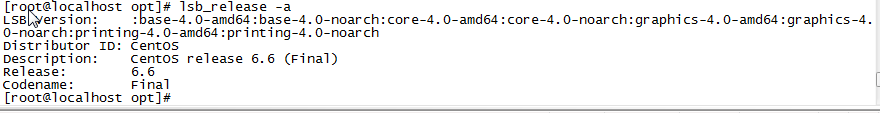
该命令适用于所有的linux,包括Redhat、SuSE、Debian等发行版
2.

3.
查看系统位数
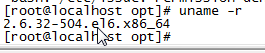
同样对于Linux系统而言也有32和64位之分,用上述查看内核方法,输入
uname -a 或 more /proc/version
在内核版本后面会有一个X86_64就是表示64为系统啦
# uname -a
x86_64则说明你是64位内核, 跑的是64位的系统.
i386, i686说明你是32位的内核, 跑的是32位的系统


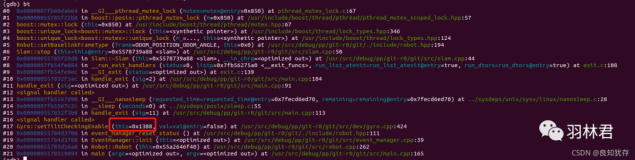
查看内核的几种方法:
1. uname -a#显示详细的内核信息,
Linux localhost.localdomain 2.6.18-92.1.6.el5xen #1 SMP Wed Jun 25 12:56:52 EDT 2008 x86_64 x86_64 x86_64 GNU/Linux
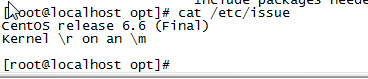
2. cat /etc/issue#显示版本类型
Scientific Linux SL release 5.2 (Boron)
Kernel \r on an \m
3. cat /proc/version
Linux version 2.6.18-92.1.6.el5xen (brewbuilder@norob.fnal.gov) (gcc version 4.1.2 20071124 (Red Hat 4.1.2-42)) #1 SMP Wed Jun 25 12:56:52 EDT 2008
查看操作系统位数:
1.ls / #如果有lib64或这个目录,那操作系统就是64位的
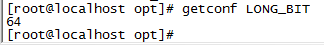
2.getconfig LONG_BIT 若输出32即为32位系统,64为64位系统
32位的系统中int类型和long类型一般都是4字节,
64位的系统中int类型还是4字节的,但是long已变成了8字节。
inux系统中可 用"getconf WORD_BIT"和"getconf LONG_BIT"获得word和long的位数。
64位系统中应该分别得到32和64。
3. uname -a中若为X86示意为64位系统,i386等位32位系统
二.下载安装
nmon默认下载之后只是一个可执行测的文件,但是下载时根据不同的系统来进行区分的
大家可以根据自己的系统选择相应的版本。
执行命令 more /etc/issue 查看系统版本。
首先将下载的nmon_x86_64_centos6文件上传到linux服务器上

[root@localhost source]#cp nmon_x86_64_centos6 /usr/bin
[root@localhost source]#cd /usr/bin
[root@localhost source]# chmod 777 nmon_x86_64_centos6
[root@localhost source]# ./nmon_x86_64_centos6(切换到nmon_x86_rhel45文件所在的目录)
[root@localhost source]# env
[root@localhost source]# mv nmon_x86_64_centos6 nmon
[root@localhost source]# nmon(此时nmon就是全局命令)
也有可能

监控设置
15分钟=900s
#alias nmon15='nmon -f -s3 -c300 -m /root/qumf/'
nmon工具命令的使用:
#nmon -s 300 -c 288 -f -m /tmp
-s 300:表示每300秒采集一次数据,
-c 288 :表示采集288次,300*288=86400秒,刚好是1天的数据,这样运行一次这个程序就会生成一个一天的数据文件,
-m /tmp: 表示生成的数据文件的路径
-f :表示生成的数据文件名中有时间
也可以让其自动监控,每天一个文件夹,每小时一个文件,每分钟或5分采样一次
参数解释:
-s10 每 10 秒采集一次数据。
-c60 采集 60 次,即为采集十分钟的数据。
-f 生成的数据文件名中包含文件创建的时间。
-m 生成的数据文件的存放目录。
nmon -f -s 10 -c 60
-f 表示生成的数据文件名中有时间;
-s 10 表示每 10 秒采集一次数据;
-c 60 表示采集 60 次,10*60=600 秒,
刚好是 10分钟的数据,这样运行一次这个程序就会生成一个采集 10分钟数据的文件。该行命令将在当前目录中创建输出文件,其名称为:<hostname>_date_time.nmon", hostname" 是这台主机的主机名。
更多用法
crontab -e
0 0 * * * /usr/local/nmo -s300 -c288 -f -m /home/nmon/ > /dev/null 2>&1
表示:
300*288=86400 秒,正好是一天的数据。
0 8 * * 1,2,3,4,5 /usr/local/nmon -f -N -m /home/nmon/log -s 30 -c 1200
表示:
周一到周五,从早上08点开始,监控10个小时(到18:00整为止),输出到/home/nmon/log。
范例1:
自动按天采集数据:
在 crontab 中增加一条记录:
0 0 * * * nmon -s300 -c288 -f -m /home/ > /dev/null 2>&1:
300*288=86400 秒,正好是一天的数据。
范例2:
A、执行命令:#crontab -e
B、在最后一行添加如下命令:
0 8 * * 1,2,3,4,5 /nmon/scriptn/mon_x86_rhel52 -f -N -m /nmon/log -s 30 -c 1200
表示:
周一到周五,从早上08点开始,监控10个小时(到18:00整为止),输出到/nmon/log
三、nmon数据采集
1、数据采集
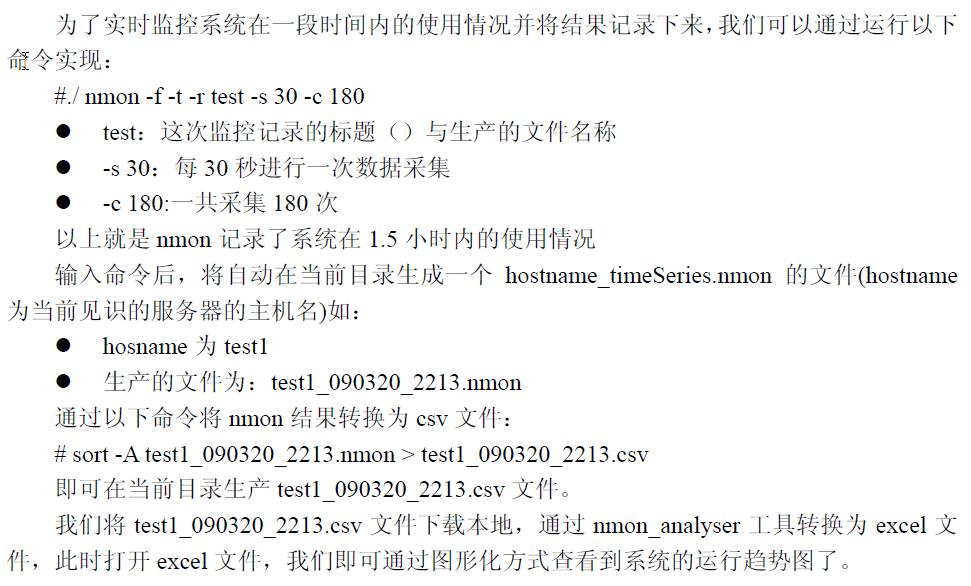
为了实时监控系统在一段时间内的使用情况并将结果记录下来,我们可以通过运行以下命令实现:
| 1 | #./ nmon -f -t -s30 -c 180 |
参数说明:
l-f:按标准格式输出文件:<hostname>_YYYYMMDD_HHMM.nmon;
l-t:输出中包括占用率较高的进程;
l-s30:每30秒进行一次数据采集
l-c180:一共采集180次
输入命令回车后,将自动在当前目录生成一个hostname_timeSeries.nmon的文件,nmon输出文件的命名方式是服务器名_日期时间.nmon
特别说明:
该命令启动后,会在nmon所在目录下生成监控文件,并持续写入资源数据,直至360个监控点收集完成——即监控1小时,这些操作均自动完成,无需手工干预,测试人员可以继续完成其他操作。如果想停止该监控,需要通过“#ps–ef|grepnmon”查询进程号,然后杀掉该进程以停止监控。
[root@localhost source]# hostname
linux_test
[root@localhost source]# ./nmon -f -s 10 -c 60
[root@localhost source]# ps -ef | grep nmon
root 17815 1 0 08:22 pts/1 00:00:00 ./nmon -f -s 10 -c 60
root 17888 6977 0 08:22 pts/1 00:00:00 grep nmon
[root@localhost source]# ls linux_test_120724_0822.nmon
linux_test_120724_0822.nmon
当我们执行相关命令后,就在当前目录生成了一个以本主机名linux_test开头,以执行日期为规则,nmon结尾的文件,并且我们通过ps命令会看到相关的nmon进程,这里我们当10分钟过去以后我们会发现相关nmon进程会消失的。
linux_test_120724_0822.nmon 就是我们所生成的数据文件,所有的信息都在linux_test_120724_0822.nmon记录,而且我们通过more命令后发现都是我们看不懂的一些文本,这就需要我们把其转化成我们能看懂的excel格式的文件。首先我们把linux_test_120724_0822.nmon文件导出到我们的windows本地。然后我们从http://www.ibm.com/developerworks/wikis/display/Wikiptype/nmonanalyser
下载nmonanalyser软件到windows本地。打开解压缩文件后,我们会发现2个文件,一个是nmonanalyse的说明word格式的说明稳定,另一个是excel格式的nmonanalyse文件。
我们这里所需要的就是excel格式问文件,我们双击打开。
四.生成图形化结果
下载 nmon analyser (生成性能报告的免费工具):
下载地址:
解压之后可以得到一个nmon analyser v34a.xls,
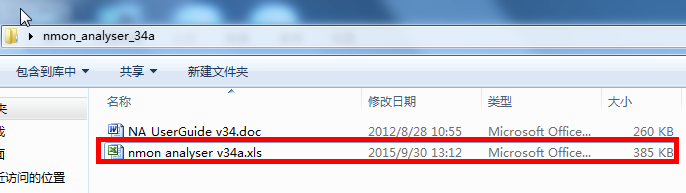
双击打开nmon analyser v34a.xls;
设置excel宏的安全级别调低
选中上图中的选项,
打开nmon_analyser中的excel,然后载入nmon数据,保存输出的excel即可。
动态显示:
1、概述
监控,在检查系统问题或优化系统性能工作上是一个不可缺少的部分。通过操作系统监控工具监视操作系统资源的使用情况,间接地反映了各服务器程序的运行情况。根据运行结果分析可以帮助我们快速定位系统问题范围或者性能瓶颈点。
nmon是一种在AIX与各种Linux操作系统上广泛使用的监控与分析工具,相对于其它一些系统资源监控工具来说,nmon所记录的信息是比较全面的,它能在系统运行过程中实时地捕捉系统资源的使用情况,并且能输出结果到文件中,然后通过nmon_analyzer工具产生数据文件与图形化结果。
nmon所记录的数据包含以下一些方面(也是我们在寻找问题过程中所关注的资源点):
● cpu占用率
● 内存使用情况
● 磁盘I/O速度、传输和读写比率
● 文件系统的使用率
● 网络I/O速度、传输和读写比率、错误统计率与传输包的大小
● 消耗资源最多的进程
● 计算机详细信息和资源
● 页面空间和页面I/O速度
● 用户自定义的磁盘组
● 网络文件系统
另外在AIX操作系统上,nmon还能监控到其他的一些信息,如异步I/O等。
2、下载安装nmon
如何获取nmon呢?我们可以在IBM的官方网站上免费下载获取,下载网址为:http://www.ibm.com/developerworks/wikis/display/WikiPtype/nmon。
nmon的安装步骤如下:
1)用root用户登录到系统中;
2)建目录:#mkdir /test;
3)把nmon用ftp上传到/test,或者通过其他介质拷贝到/test目录中;
4)执行授权命令:#chmod +x nmon。
3、nmon数据采集
3.1 数据采集
为了实时监控系统在一段时间内的使用情况并将结果记录下来,我们可以通过运行以下命令实现:
#./ nmon -f -t -s 30 -c 180
n -f:按标准格式输出文件:<hostname>_YYYYMMDD_HHMM.nmon;
n -t:输出中包括占用率较高的进程;
n -s 30:每30秒进行一次数据采集
n -c 180:一共采集180次
输入命令回车后,将自动在当前目录生成一个hostname_timeSeries.nmon的文件,如果hosname为test1,生产的文件为:test1_090308_1313.nmon。
通过sort命令可以将nmon结果文件转换为csv文件:
# sort -A test1_090308_1313.nmon > test1_090308_1313.csv
执行完sort命令后即可在当前目录生产test1_090308_1313.csv文件。
3.2 生成图形化结果
为了分析nmon监控获得的结果,IBM还提供了相应的图形化分析工具nmon_analyser,通过nmon analyser.xls工具可以把监控的结果文件转换成excel文件,方便分析系统的各项资源占用情况。
nmon analyser.xls工具的使用方法如下:
(1)打开nmon analyser.xls工具;
(2)调整excel宏安全性:工具-宏-安全性
(修改安全级别与可靠发行商)
(选择)安全级别:低
(勾上)信任所有安装的加载项和模板
(勾上)信任对于“Visual Baisc项目”的访问
(3)修改完后,确定-关闭nmon analyser.xls,重新打开;
(4)点击Analyse nmon data按钮,加载之前下载的test1_090308_1313.csv文件。
以下是分析结果的截图:
以上就是nmon的简单描述与使用介绍,大家可以根据自己所采集到的结果分析系统的情况。
nmon for Linux - nmon is short for Nigel's performance Monitor for Linux on POWER, x86, x86_64, Mainframe & now ARM (Raspberry Pi)
STOP PRESS: nmon for Linux Hits 500,000 downloads July 2017
| This systems administrator, tuner, benchmark tool gives you a huge amount of important performance information in one go. It can output the data in two ways
|
 |
More details
- nmon is a single binary for
- each operating system (Red Hat, SUSE, Ubuntu, Fedora, OpenSUSE etc.) and
- each platform (Power, Mainframe, arm, x86 or x86_64).
- Installing is very easy - just start the right executable.
- Or rename the version you need to /usr/bin/nmon and then type: nmon
- Why use five or six tools when one free tool can give you everything you need!!
- For the pre-compiled versions - click on Download
- For the source code & compiling - click on Compiling nmon
On-screen
When using nmon via a terminal session you can see the performance data directly on the screen and updated every second. You should if possible, stretch the terminal window to be longer to see more stats at one time. Here is a sample example from a Raspberry Pi 2 running Ubuntu 15.10 and nmon v16b. I typed "cCUd" to display this data.
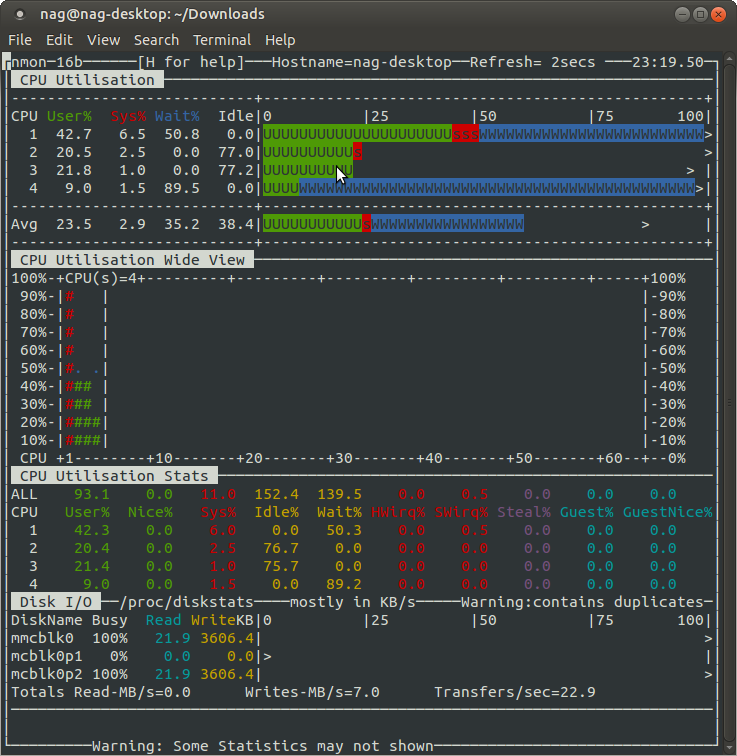
For more screen shots take the left-hand side menu option Screen shots or click Screen shots.
Data Analysis
Once you save the nmon data you have a number of options to analyse and graph the statistics:
- nmonchart tool/script - see left hand menu
- Nigel's nmonchart tools is quick and simple to convert a nmon output file to a webpage file .html that you can open with a browser directly or add to a website to share.
- It takes a second or too and generates very nice looking graphs.
- It is implemented in Korn shell script so you can add features (please share your updates).
- The Clever part is using the Google.com Charting Javascript Library and your browser to do the actual graphing.
- This this works on your PC, tablet or even larger mobile phone regardless of operating system.
- Click here to find out more nmonchart
- nmon Analyser Excel Spread-sheet Download
- This is the original tool and been developed over many years by Stephen Atkins
- You can request support via the Performance Tools Forum
- However, Linux users might not like the idea of using the Microsoft Excel Spreadsheet and automating the creation of graphs can be tricky.
- Sample Graphs out of the many (see screen shots for more and larger examples:
- CPU Compared to Disk I/O
-
- Disk Read and Write with I/O per second
-
- Hot Disk analysis with Average, Weighted Average and Peak values
-

- Network Read (top half) and Write (bottom half) Transfer Rates
-
- nmon Consolidator Excel Spread-sheet Download
- This is a newer tool and can combine nmon output files. It is by Stephen Atkins
- Again its Microsoft Excel Spreadsheet
- nmon2rrd
- Microsoft free tool
- This tool uses the excellent rrdtool to generate all the graphs and a website .html file.
- Download it from the nmon for AIX Wiki
- This allows the automated analysis on many machines and viewing via a Browser.
Now - Open Source
nmon for Linux is a single source code file of 5000 lines and single makefile. This will enable you to compile nmon for your precise Linux version (if you can't find what you want in the binaries) and open a few other possibilities:
- Fixing my code - be gentle, please.
- Removing magic numbers i.e. constants that can catch us out as machines get larger
- Developing for some strange environments like machines with no disks, blades that boot from NFS, internal Linux based engines within disks subsystems, embedded machines.
- Who knows we may get nmon for Linux within the Linux Distro's - any one know how to go about that?
Thanks for your support, suggestions, testing and I hope this starts a whole new wave of development and interest.
History
- nmon for Linux was an internal project at IBM for many years and was released to open source under GPL on 27th July 2009.
- Sourceforge.net is being used to host the project, see http://sourceforge.net/projects/nmon
- nmon for AIX does has a similar online look, file format but was always complete different source code.
- It is now integrated into AIX topas command from
- AIX 5.3 TL09
- AIX 6.1 TL02.
- nmon for AIX is not open source.
- For more information nmon for AIX Wiki
- It is now integrated into AIX topas command from
Documentation
nmon of Linux Documentation - Updated 21st Nov 2016
Ha ha ha ha - you are joking right :-)
This page contains the following sections:
- Hardware and Linux Supported
- Getting Started via YouTube Videos - Including nmon for Linux and nmon for AIX
- Getting Started - If you prefer to read the absolute minimum
- nmon Command help - nmon for Linux -? and -h command output for the full syntax
- nmon Support
- Other sources
Hardware and Linux Supported
- Platforms = hardware
- POWER
- x86_64 = AMD64 - 63 bit
- Mainframe
- x86 = 32 bit dropping off rapidly
- ARM Raspberry Pi 2+3
- Others . . . include embedded processors running Linux
- Linux Distro’s
- Ubuntu
- Debian
- SUSE SLES
- OpenSUSE
- Red Hat RHEL
- Fedora
- Centos
- Many others . . .
YouTube Videos about nmon for Linux
Many People prefer to watch a YouTube Video to learn - here are the six videos on nmon for both Linux and AIX operating systems. These are all the details you need to know to use nmon well. Note: nmonchart creates a .html file of all the graphs - it is one of many nmon graphing tools.
nmon for Linux
- nmon for Linux Starter Pack 20 minutes
- nmon for Linux Data Capture 15 minutes
- nmonchart to graph your nmon data files 22 minutes
Many nmon users use both Linux and AIX so here are the AIX equivalent videos and many nmon for Linux user use the nmon Analyser (Microsoft Excel spreadsheet)
nmon for AIX
- nmon Starter Pack Monitoring Online 14 minutes
- nmon Starter Pack for AIX Data Capture 15 minutes
- nmon Starter Pack for AIX Analyser 10 minutes
nmon for Linux Getting Started - If you prefer to read the absolute minimum
Below assumes that you are logged on your system, that you have renamed your nmon binary file to just "nmon", that the nmon file has execute permission (chmod ugo+x nmon) and it is in your PATH.
Using nmon for Linux Online
- Just start nmon for Linux with: nmon
- To stop it, just type: q
- To get on screen hints type: h
- and h again to remove the hints
- Most of the rest are toggled commands i.e. type c to see the CPU stats and type c again to remove CPU stats.
- The various stats come out in a set order (you can't control this) starting with CPU then memory and finally top processes at the bottom as there can be many processes this tends to fill up the rest of the window
- Note if you make the window larger you can see more lines of output - this works in X Windows, VMC and Putty.
- For memory stats type m
- For disk graphs type d and you will see a 50 column graph of the read and write busy percentages
- For disk numbers type D and if you type D again you see different information eventually typing D will close this section
- For top processes there are different modes for the order of displaying the processes and different information, See the top line of the Top Processes section for further details.
Using nmon for Linux in data capture mode
- Start by capturing a small sample file. Type: nmon -f -s2 -c 30
- The -f means you want the data saved to a file and not displayed on the screen.
- The -s 2 means you want to capture data every 2 seconds
- The -c 30 means you want thirty data points or snap shots
- This means that after a few seconds collecting the configuration nmon for Linux will run for 2 x 30 = 60 seconds and stop. At the end some further configuration data is collected.
- As nmon for Linux start up briefly check you system and options and then disconnect from you terminal sessions.
- It then runs like a daemon process in the background. The point is that if you log out or get disconnected then nmon will complete the data file capture - this is a good thing.
- If you want to be sure nmon is still running you can't use a simple "ps" because it is not associated with your log on session. Use "ps -ef | grep nmon" instead.
- It is a common mistake to try to start using nmon for Linux output file before nmon has finished - this results in a either incomplete data which messes up a later tool or if you asked to a longer time between snap shots then there may be no data actually in the file, which confuses all tools trying to analyse the file.
- Once nmon for Linux has finished and to build confidence try:
- Use: grep ZZZZ yourfile.nmon
- This should output the one line for each snapshot and date and time it happened.
- Edit the nmon file with vi. You will notice it is a simple text file The start of each line defines the content of the line and then the values are separated with commas. This means the file can be imported in to a spread sheet. If you want to manually import the file, make sure you sort the file first (with the um er "sort" command). This sort means all the lines of a particular type are together. A sort is not required by most of the nmon for Linux analysing tools as they perform the function themselves.
- Use: grep ZZZZ yourfile.nmon
Hint for nmon version 16d
# ./nmon -h
Hint for nmon version 16d
        Full Help Info : nmon -h

        On-screen Stats: nmon
        Data Collection: nmon -f [-s <seconds>] [-c <count>] [-t|-T]
        Capacity Plan  : nmon -x
Interactive-Mode:
        Read the Welcome screen & at any time type: "h" for more help
        Type "q" to exit nmon
For Data-Collect-Mode
        -f            Must be the first option on the line (switches off interactive mode)
                      Saves data to a CSV Spreadsheet format .nmon file in then local directory
                      Note: -f sets a defaults -s300 -c288    which you can then modify
        Further Data Collection Options:
        -s <seconds>  time between data snapshots
        -c <count>    of snapshots before exiting
        -t            Includes Top Processes stats (-T also collects command arguments)
        -x            Capacity Planning=15 min snapshots for 1 day. (nmon -ft -s 900 -c 96)
End of Hints
Full Help Information for nmon 16d
For Interactive and Data Collection Mode:
        User Defined Disk Groups (DG) - This works in both modes
        It is a work around Linux issues, where disks & partitions are mixed up in /proc files
        & drive driver developers use bizarre device names, making it trick to separate them.
        -g <filename> Use this file to define the groups
                      - On each line: group-name <disks-list>   (space separated list)
                      - Example line: database sdb sdc sdd sde
                      - Up to 64 disk groups, 512 disks per line
                      - Disks names can appear more than one group
        -g auto       - Will generate a file called "auto" with just disks from "lsblk|grep disk" output
         For Interactive use define the groups then type: g or G
         For Data Capture defining the groups switches on data collection
Data-Collect-Mode = spreadsheet format (i.e. comma separated values)
        Note: Use only one of f, F, R, x, X or z to switch on Data Collection mode
        Note: Make it the first argument then use other options to modify the defaults
        Note: Don't collect data that you don't want - it just makes the files too large
        Note: Too many snapshots = too much data and crashes Analyser and other tools
        Note: 500 to 800 snapshots make a good graph on a normal size screen
        Recommended normal minimal options: snapshots every 2 minutes all day:
                Simple capture:      nmon -f  -s 120 -c 720
                With Top Procs:      nmon -fT -s 120 -c 720
                Set the directory:   nmon -fT -s 120 -c 720 -m /home/nag/nmon
                Capture a busy hour: nmon -fT -s   5 -c 720 -m /home/nag/nmon
For Data-Collect-Mode Options
        -f            spreadsheet output format [note: default -s300 -c288]
                         output file is <hostname>_YYYYMMDD_HHMM.nmon
        -F <filename> same as -f but user supplied filename
                         Not recommended as the default file name is perfect
        The other options in alphabetical order:
        -a            Include Accelerator GPU stats
        -b            Online only: for black and white mode (switch off colour)
        -c <number>   The number of snapshots before nmon stops
        -d <disks>    To set the maximum number of disks [default 256]
                      Ignores disks if the systems has 100's of disk or the config is odd!
        -D            Use with -g to add the Disk Wait/Service Time & in-flight stats
        -f and -F     See above
        -g <filename> User Defined Disk Groups (see above) - Data Capture: Generates  BBBG & DG lines
        -g auto       See above but makes the file "auto" for you of just the disks like sda etc.
        -h            This help output
        -I <percent>  Set the ignore process & disks busy threshold (default 0.1%)
                      Don't save or show proc/disk using less than this percent
        -l <dpl>      Disks per line in data capture to avoid spreadsheet width issues. Default 150. EMC=64.
        -m <directory> nmon changes to this directory before saving to file
                      Useful when starting nmon via cron
        -M              Adds MHz stats for each CPU thread. Some POWER8 model CPU cores can be different frequencies
        -N            Include NFS Network File System for V2, V3 and V4
        -p            nmon outputs the PID when it starts. Useful in scripts to capture the PID for a later safe stop.
        -r <runname>  Use in a benchmark to record the run details for later analysis [default hostname]
        -R              Old rrdtool format used by some - may be removed in the future. If you use this email Nigel
        -s <seconds>  Time between snap shots - with "-c count" decides duration of the data capture
        -t            Include Top Processes in the output
        -T            As -t plus it saves command line arguments in UARG section
        -U            Include the Linux 10 CPU utilisation stats (CPUUTIL lines in the file)
        -V            Print nmon version & exit immediately

        To manually load nmon files into a spreadsheet:
                sort -A *nmon >stats.csv
                Transfer the stats.csv file to your PC
                Start spreadsheet & then Open with type=comma-separated-value ASCII file
                This puts every datum in a different cell
                Now select the data of one type (same 1st column) and graph it
                The nmon Analyser & other tools do not need the file sorted.
Capacity Planning mode - use cron to run each day
        -x            Sensible spreadsheet output for one day
                      Every 15 mins for 1 day ( i.e. -ft -s 900 -c 96)
        -X            Sensible spreadsheet output for busy hour
                      Every 30 secs for 1 hour ( i.e. -ft -s 30 -c 120)
        -z            Like -x but the output saved in /var/perf/tmp assuming root user
Interactive Mode Keys in Alphabetical Order
    Start nmon then type the letters below to switch on & off particular stats
    The stats are always in the same order on-screen
    To see more stats: make the font smaller or use two windows

        Key --- Toggles on off to control what is displayed ---
        b   = Black and white mode (or use -b command line option)
        c   = CPU Utilisation stats with bar graphs (CPU core threads)
        C   = CPU Utilisation as above but concise wide view (up to 192 CPUs)
        d   = Disk I/O Busy% & Graphs of Read and Write KB/s
        D   = Disk I/O Numbers including Transfers, Average Block Size & Peaks (type: 0 to reset)
        g   = User Defined Disk Groups            (assumes -g <file> when starting nmon)
        G   = Change Disk stats (d) to just disks (assumes -g auto   when starting nmon)
        h   = This help information
        j   = File Systems including Journal File Systems
        k   = Kernel stats Run Queue, context-switch, fork, Load Average & Uptime
        l   = Long term Total CPU (over 75 snapshots) via bar graphs
        L   = Large and =Huge memory page stats
        m   = Memory & Swap stats
        M   = MHz for machines with variable frequency 1st=Threads 2nd=Cores 3=Graphs
        n   = Network stats & errors (if no errors it disappears)
        N   = NFS - Network File System
              1st NFS V2 & V3, 2nd=NFS4-Client & 3rd=NFS4-Server
        o   = Disk I/O Map (one character per disk pixels showing how busy it is)
              Particularly good if you have 100's of disks
        p   = PowerVM LPAR Stats from /proc/ppc64/lparcfg
        q   = Quit
        r   = Resources: Machine type, name, cache details & OS version & Distro + LPAR
        t   = Top Processes: select the data & order 1=Basic, 3=Perf 4=Size 5=I/O=root only
        u   = Top Process with command line details
        U   = CPU utilisation stats - all 10 Linux stats:
              user, user_nice, system, idle, iowait, irq, softirq, steal, guest, guest_nice
        v   = Experimental Verbose mode - tries to make recommendations
        V   = Virtual Memory stats

        Key --- Other Interactive Controls ---
        +   = Double the screen refresh time
        -   = Halves the screen refresh time
        0   = Reset peak counts to zero (peak highlight with ">")
        1   = Top Processes mode 1 Nice, Priority, Status
        3   = Top Processes mode 3 CPU, Memory, Faults
        4   = Top Processes mode 4 as 3 but order by memory
        5   = Top Processes mode 5 as 3 but order by I/O (if root user)
        6   = Highlights 60% row on Long Term CPU view
        7   = Highlights 70% row on Long Term CPU view
        8   = Highlights 80% row on Long Term CPU view
        9   = Highlights 90% row on Long Term CPU view
        .   = Minimum mode i.e. only busy disks and processes shown
        space = Refresh screen now
Interactive Start-up Control
        If you find you always type the same toggles every time you start
        then place them in the NMON shell variable. For example:
         export NMON=cmdrtn
Other items for Interactive and Data Collection mode:
        a) To limit the processes nmon lists (online and to a file)
            either set NMONCMD0 to NMONCMD63 to the program names
            or use -C cmd:cmd:cmd etc. example: -C ksh:vi:syncd
Other items for Data Collection mode:
        b) To you want to stop nmon use: kill -USR2 <nmon-pid>
        c) Use -p and nmon outputs the background process pid
        d) If you want to pipe nmon output to other commands use a FIFO:
            mkfifo /tmp/mypipe
            nmon -F /tmp/mypipe &
            tail -f /tmp/mypipe
        e) If nmon fails please report it with:
           1) nmon version like: 16d
           2) the output of: cd /proc; cat cpuinfo meminfo partitions stat vmstat
           3) some clue of what you were doing
           4) I may ask you to run the debug version or collect data files
        f) If box & line characters are letters then check: terminal emulator & $TERM
        g) External Data Collectors - nmon will execute a command or script at each snapshot time
           They must output to a different file which is merge afterwards with the nmon output
           Set the following shell variables:
            NMON_START  = script to generate CVS Header test line explaining the columns
                 Generate: TabName,DataDescription,Column_name_and_units,Column_name_and_units ...
            NMON_SNAP   = script for each snapshots data, the parameter is the T0000 snapshot number
                 Generate: TabName,T00NN,Data,Data,Data ...
            NMON_END    = script to clean up or finalise the data
            NMON_ONE_IN = call NMON_START less often (if it is heavy in CPU terms)
            Once capture done: cat nmon-file data-file >merged-file ; ready for Analyser or other tools
            The nmon Analyser will automatically do its best to graph the data on a new Tab sheet

        Developer: Nigel Griffiths     See http://nmon.sourceforge.net Feedback welcome - On the current release only
        No warranty given or implied. Copyright GPLv3
nmon for Linux Support
If you:
- need help running nmon or understanding the data saved
- have a suggestion for improvements
- have bug fixes or want to report errors
- want to extend nmon for Linux on to other platforms
- want to include nmon on your distro (not a problem, I would just like to know)
getting in touch at the nmon for Linux - Help Forum
- Alternatively use the Performance Tools Forum
NMON_Analyser User Guide for V4.6
Preface
NMON_Analyser is designed to complement NMON (Nigel’s Monitor) in analysing and reporting performance problems; it produces graphs for virtually all sections of output created using the “spreadsheet output” mode of NMON as well as doing some additional analyses for ESS, EMC and FAStT subsystems. It will also work with files produced by topasout and with other tools that produce data in “NMON” format. It is written in VBA for Excel and will work with Excel 2007 or later. It may work also on Excel 2003 with the required Microsoft updates to support .xlsx files https://support.microsoft.com/kb/924074?wa=wsignin1.0
NMON was originally written by Nigel Griffiths (nag@uk.ibm.com) and is now (since AIX 5.3 TL09 and AIX 6.1 TL02) part of topas. NMON_Analyser was originally written by Stephen Atkins with contributions from many people – including Ralf Schmidt-Dannert and Markus Fehling, both of IBM. Currently nmon Analyzer is maintained by Ron McCargar (mccargar@us.ibm.com.)
Support for NMON_Analyser is provided on a best efforts basis. Please direct questions to the User Forum (see below) rather than contact the author direct.
Links:
NMON_Analyser home page https://www.ibm.com/developerworks/community/wikis/home?lang=en#!/wiki/Power%20Systems/page/nmon_analyser
Collecting data using NMON
Please make sure you have the latest versions of both NMON and NMON_Analyser before starting a new engagement. If you want automatic notification of a new release of the Analyser send a note to steve_atkins@uk.ibm.com and I’ll add you to my distribution list. Nigel maintains a similar list for NMON.
You will need to have root privileges in order to get a complete set of data on the BBBP sheet. In order to collect data for the DISKBUSY sheets you need to make sure that iostat data collection is enabled:
chdev -l sys0 -a iostat=true
For spreadsheet output mode (comma separated values) use the following flags when invoking nmon:
-f spreadsheet output format [note: default -s300 -c288]
Output file is <hostname>_YYYYMMDD_HHMM.nmon
-F <filename> same as -f but user supplied filename
-c <number> number of snapshots
-d requests disk service and wait times (DISKSERV and DISKWAIT)
-i <percent> Ignore processes using less than this amount of CPU when generating TOP section – useful for reducing data volumes
-g <filename> file containing disk group definitions
-l <dpl> number of hdisks per sheet - defaults to 150, maximum 250. See notes
-m <dir> NMON changes to this directory before saving the file
-r <runname> goes into spreadsheet file [default hostname]
-s <seconds> interval between snap shots
-x capacity planning (15 mins for 1 day = -fdt -s900 -c96)
-t include top processes in the output
-T as –t plus saves command line arguments in UARG section
-A include data for async I/O (PROCAIO) sections
-D prevents DISK sections being produced (useful when Disk Groups are being used because there are too many hdisks to process)
-E stops ESS sections being produced (necessary when Disk Groups are being used because there are too many vpaths to process)
-J prevents JFS sections being produced (prevents Excel errors when you have more than 255 filesystems)
-L includes LARGEPAGE section
-N include NFS sections
-S include WLM sections with subclasses
-W include WLM sections without subclasses
-Y include SUMMARY section (very efficient alternative to –t if PID level data is not required)
example: nmon_aix51 -F asterix.nmon -r Test1 -s6 -c12
Notes:
1. The –f (or –F) flag must appear first.
2. The value of the -l flag controls the number of hdisks per sheet on the DISK sheets and per line on the BBBD sheet. There are two factors to consider when choosing this value. Excel has a limit of 256 columns per sheet; however, both NMON and NMON_Analyser use some columns, so the upper limit is really 250. The second factor is that Excel VBA has an upper limit of 2048 bytes for input line length. This particularly affects users of EMC systems that use long hdisk names (e.g. hdiskpower123). The default of 150 is safe for such systems. Other users may set the value to 250 in order to reduce the number of output sheets.
3. Consider the value of the -s flag very carefully. The shorter the interval between snapshots, the more variable the values for each resource will be. If you use an interval of 1 second, don’t be surprised to see many of your disks hitting 100% busy for short periods. For normal monitoring, 10-minute intervals (-c 600) provide a good balance.
4. The graphs produced by NMON_Analyser look best when the number of snapshots (specified by the -c flag) is 300 or less.
5. The TOP section (produced by specifying the -t flag) can generate large amounts of output and the size of the output can grow exponentially if a large value is specified for the -c flag. If you want the TOP section then specify no more than 250 snapshots - ideally less.
Collecting data using topas (xmwlm)
You need AIX V5.3 TL5 Service pack 4 with APAR IY87993 or later. Note that only the output using the –a flag can be analysed. In particular, cross-partition statistics cannot be analysed; if you wish to get a report for the entire machine, collect data from each LPAR separately and then use NMON_Consolidator to merge the data. Commands like the following are required to collect the data.
topasout -a /etc/perf/daily/xmwlm.yymmdd
:
cp /etc/perf/daily/xmwlm.yymmdd_01 hostname.ddmmyy.topasout.csv
Using NMON_Analyser
· FTP the input file to your PC – ideally using the ASCI or TEXT options to make sure that lines are terminated with the CRLF characters required by Windows applications.
· Open the NMON_Analyser spreadsheet and specify the options you want on the “Analyser” and “Settings” sheets (see below). Save the spreadsheet if you want to make these options your personal defaults.
? Click on the "Analyse nmon data" button and find/select the .nmon file(s) to be processed. You may select several files in the same directory. If you wish to process several files in different directories you may wish to consider using the “FILELIST” option described below.
? You may see the message SORT command failed for “filename” if the file has >65K lines and the filename (or directory name) contains blanks or special characters. Either rename the file/directory or just pre-sort the file before using the Analyser.
Analyser options
GRAPHS The first option is either ALL or LIST. If the value is LIST then only those sheets which appear in the LIST on the Settings sheet will have graphs drawn for them. This option is particularly useful if the graphs are to be printed/published or to reduce the amount of memory/fonts/disk space required when analysing files from large systems.
The second is either CHARTS, PICTURES, PRINT or WEB. The meaning of these are as follows:
· CHARTS produce Excel charts in-place on the selected sheets
· PICTURES graphs will be produced on a separate “Charts” sheets as pictures. Selecting this option can reduce the size of the output file by up to 90%.
· PRINT implies PICTURES. Pictures will be printed to the designated printer (see “Printing Options” below)
· WEB implies PICTURES. Automated web publishing (see “Web Publishing” below)
INTERVALS specifies the first and last time interval to be processed. Intervals outside this range will be discarded after parsing. Note that these are numbers between 1-999999 and are not time values. Setting a value of 2 for the first interval is useful in discarding the very large numbers that often appear at the start of an NMON collection run with AIX. If you have used a splitter program on the input file, or if you are analysing data from a LINUX system, then you should leave this as 1.
TIMES specifies the first and last time/date to be processed. Samples outside this range will be discarded after parsing. They can be specified in any form recognised by Excel as time/date values; e.g.
14:00:10 16:15:30
4-Aug-12 6-Aug-12
18:00 28/6/12 04:00
Notes:
· Specifying a date without a time is the same as specifying a time of 00:00.
· If the second time is less than the first then Analyser will assume the second time is in the next calendar day
· If there are no qualifying intervals in the file a message will be issued:
“Invalid values for FIRST/LAST - values reset to 1/999999”
and the entire file will be processed.
MERGE specifying YES here results in NMON_Analyser merging all of the input files to form a single file. The input files must be unsorted. By default the Analyser will delete the TOP and UARG sections during the merge process; specify TOP to prevent this from happening but be aware that processing time will be increased and that if the TOP section exceeds the maximum number of lines per sheet (depending on the version of Excel) then data will be lost. Specify KEEP to stop the merged file from being deleted at the end of the run. Specify ONLY if you simply want to create a merged file for future analysis.
PIVOT specifying YES here results in NMON_Analyser creating a Pivot Chart from the specified sheet after all other processing (including printing/publishing the other charts) has completed. See additional parameters on the “Settings” sheet.
ESS specifying NO here results in NMON_Analyser bypassing the additional analysis performed for ESS subsystems. This will result in faster analysis and can allow larger files to be analysed successfully when “out of memory” errors occur.
FILELIST the name of a control file containing a list of nmon output files to be processed by the Analyser. Leave this field blank for normal operation. The name must be fully qualified (e.g. c:\nmon\testcases\filenames.txt). The names specified in the text file must contain full path information. Wildcard characters may be included in the filenames so long as they conform to Windows standards. For example:
c:\nmon\testcases\*.nmon
NB: if you save the spreadsheet with a value in this field, the Analyser will automatically begin execution the next time you open it. This is defined as “batch mode” (see Appendix). You can stop the execution by pressing Ctrl+Break or by deleting/renaming the Control File.
Batch Processing Options
The following fields can be found on the “Settings” sheet.
REPROC Change this to NO if you want to bypass processing of input files which may have been processed in a previous run. This is useful if you make use of wildcards in the batch control file. Note that the REPROC option only takes effect when you have specified more than one input file.
OUTDIR the name of an existing directory in which output files will be saved by default. This is primarily intended for batch operation (see FILELIST above) but also works to set the default directory for interactive sessions. If the directory does not exist (or OUTDIR is blank) then output files are saved back to the same directory as the corresponding input files.
Example: C:\NMON\Analyser\Output\
Formatting Options
The following fields can be found on the “Settings” sheet.
BBBFont Enter the name of a fixed pitch font to be used for formatting the BBBC and BBBP sheets. Courier provides acceptable results.
GWIDTH Change the values in this row to make the generated graphs bigger or smaller. The default value of 0 means that the Analyser will dynamically size the graphs according to your screen size, font settings or page size. Be careful not to set a value larger than your page width when printing.
GHEIGHT Change the values in this row to make the generated graphs bigger or smaller. If you specify a value here you must also specify a value for GWIDTH.
LIST A comma-separated list a sheets for which the Analyser is to draw graphs. Only used if the GRAPHS option is set to LIST. The list can contain any valid wildcard characters recognised by Excel, e.g. “EMC*”
Note: graphs are always drawn for SYS_SUMM, CPU_SUMM and DISK_SUMM
NOLIST The default is KEEP. If you change this to DELETE then all sheets which do not appear in LIST will be deleted after analysis. This can dramatically reduce the size of files that are to be kept for long periods.
CPUmax Specifies the maximum number of CPUnnn, PCPUnnn and SCPUnnn sheets that will be generated. The default value of 0 will choose all sheets for an LPAR using dedicated processors and number equal to the SMT mode for an LPAR using shared processors.
REORDER specifying YES here results in NMON_Analyser reordering the sheets to improve navigation to more relevant information.
TOPDISKS the maximum number of hdisks/vpaths to include on disk graphs. A value of 0 produces graphs containing all the hdisks on a sheet (up to 250). Graphs containing more than 50 hdisks will be automatically scaled to fit and may therefore exceed the size of the screen.
xToD Format to be used for timestamps on Time of Day graphs. Anything acceptable to Excel as a Number Format Code may be entered. Default is hh:mm. Note that the date is also available within the timestamp and you may therefore use something like dd-mmm-yy hh:mm if, for example, you have merged multiple NMON files together. If you use something other than the default string you may need to increase the value of GHEIGHT – experiment with different values if you don’t see what you expect.
SORTDEFAULT This setting indicates if the 1st graph on 'default' sheets (ones not handled else where by the Analyzer) are sorted. Note: If Yes, this will also reorder the columns.
Pivot Chart
These parameters are used to construct a pivot chart. The required parameters are: Sheetname, PageField, RowField, ColumnField, DataField and xlFunction (can be COUNT, SUM, MIN, AVG, MAX). This is primarily useful for the TOP and SUMMARY sheets but might prove useful for other, possibly user-supplied, data sheets.
Printing Options
The following fields can be found on the “Settings” sheet. Note - these only take effect if you select PRINT for the OUTPUT option on the Analyser sheet.
LSCAPE Change to YES if you want the Analyser to set the page orientation to Landscape. By default the Analyser will fit one chart per page when printing landscape.
COPIES Set to the number of copies to be printed.
PRINTER The name of the printer. Specifying a value of PREVIEW will cause the Analyser to invoke the Excel print preview function - useful for testing. You may also specify DEFAULT to print to the system default printer or the name of network printer.
The Analyser adds page headers and footers.
Web Publishing Options
The following fields can be found on the “Settings” sheet.
PNG Change to NO if your browser can’t handle the PNG graphics format. Graphics will be generated as GIF files.
SUBDIR If this is YES then all supporting files, such as background textures and graphics, are organized in a separate folder. If this is NO then supporting files are saved in the same folder as the Web page.
WEBDIR the name of an existing directory in which HTML files will be saved by default. If the directory does not exist (or OUTDIR is blank) then output files are saved back to the same directory as the corresponding input file.
Example: C:\NMON\Analyser\HTML\
Interpreting the output sections
Notes on the “Weighted Average” as used in the Analyser
Several graphs produced by the Analyser show average, weighted average and maximum values. Although everyone understands averages and maximums, the concept of a weighted average is a little more difficult to grasp.
One of the problems we are faced with in analysing sample data is that resources on the target system may be idle for long periods during the collection. For example, the NMON data collection may be started some time before the system reaches peak utilisation and may not be stopped until the workload being monitored has long since finished. Although this does not affect the maximums it can severely affect the accuracy of the averages.
The idea of a weighted average is to apply a weighting factor to each snapshot to indicate how relevant that snapshot is to the average. In NMON_Analyser, we use the value of the measurement itself as the weighting factor. In effect, this produces a figure that shows how busy a resource is when it is active. For example: a database log disk is only active during the middle part of a benchmark. We record the following figures for %tm_act (DISKBUSY):
| Snapshot |
%tm_act |
| 1 |
0 |
| 2 |
0 |
| 3 |
0 |
| 4 |
0 |
| 5 |
0 |
| 6 |
6.1 |
| 7 |
6.3 |
| 8 |
6.5 |
| 9 |
9.1 |
| 10 |
5.9 |
| 11 |
0 |
| 12 |
0 |
| 13 |
0 |
| 14 |
0 |
| 15 |
0 |
The average for this set of data is 2.3 and the weighted average is 7.0. The weighted average gives a better picture of how busy the disk is while logging is taking place. NMON_Analyser uses the weighted average as a sort key when sorting the contents of disk sheets.
Note that, occasionally, NMON generates very large numbers for the first interval and this heavily skews the weighted average values. If you see this problem occurring then change the value for the FIRST parameter to 2 in order to exclude the first interval completely. This is only a problem for AIX.
SYS_SUMM
This section is entirely generated by the Analyser and contains a useful summary of data taken from other sheets. Note the the avg/max values for User%, Sys%, Wait% and Idle% are independent and will not add up to 100%. The CPU% column shows User% + Sys % for each line.
For non-partitioned or dedicated CPU partitions the graph shows the total CPU Utilisation (%usr + %sys) together with the Disk I/O rate (taken from the DISKXFER sheet) by time of day. For micro-partitions the graph shows the number of physical CPUs being used instead of CPU%.
The value “Max:Avg” is simply the maximum value divided by the average. If monitored over a long period of time the value for CPU% can be useful in spotting a system reaching saturation level (the ratio will steadily decrease). If you have historical data then the value can also be useful in determining how much latent demand is present in a system running at saturation level.
AAA
The AAA section is generated by NMON at the start of the data collection and contains information about the system and NMON itself – contents vary by release, following is for 12e
AIX this is the release / maintenance level of AIX being used on the target system as reported by the lslpp command.
build the particular build of nmon used to collect this data
command the command line used to invoke NMON and the date when it finished.
cpus the number of CPUs in the system and the number active at the start of data collection.
date date at the start of the collection.
disks_per_line the setting of the -l flag on the NMON command line or the default value.
hardware the processor technology used in the target system.
host the hostname of the target system.
Interval the time (in seconds) between snapshots.
kernel information from the kernel - useful in identifying the type of kernel (32-bit or 64-bit) and whether this is an LPAR.
LPARNumberName the LPAR number followed by the name
MachineType machine type and model of the system
progname the name of the NMON executable.
runname taken from the NMON command line if specified using the -r parameter, else defaults to hostname.
SerialNumber the machine serial number
snapshots the number of snapshots - this is used by the Analyser. The Analyser will modify this value to match the number of snapshots actually found in the input file.
steal this value will be a 1 if running on Linux and Steal% CPU is provided in the CPUnnn and CPU_ALL data.
subversion detailed information about the nmon version used to collect this data – including the date and time it was created.
time time as shown by the system clock at the start of the collection. Also see date value.
timestampsize the number of characters used for timestamps in each record. The default is 5.
TL the Technology Level of the AIX release
user the name of the user executing the NMON command.
version the version of NMON used to collect this data.
VIOS the release/maintenance level if this is a VIOS LPAR.
analyser the version of NMON_Analyser used to generate the output file together with the elapsed time (in seconds) for processing this file.
environment the version of Excel you are using.
parms the values of most of the user options specified on the “Analyser” sheet.
settings the values of most of the user options specified on the “Settings” sheet.
elapsed the execution time of the Analyser. I use this for tuning.
NodeName the name of the LPAR’s node name
NMON_Analyser deletes the NOTES lines generated by NMON.
BBBB
The BBBB sheet lists all of the disks listed in the ODM together with the capacity (in Gbytes) and the adapter type (SCSI/SSA/Fibre) as reported by lsdev. Note that some fibre-attached devices do not report their capacity to AIX.
NMON_Analyser deletes the column containing the sort key generated by NMON on all BBB sheets.
BBBC
The BBBC sheet shows the output from the lspv command for all local disks at the start of the data collection. The Analyser highlights the hdisk name using a bold font and sets the sheet to use the fixed-pitch font specified on the NLS sheet (default Courier) in order to improve readability.
BBBD
The BBBD sheet shows a list of all I/O adapters listed in the ODM together with the hdisks addressed through that adapter.
BBBE
The BBBE sheet contains data extracted from the lsdev command and shows the mapping between vpaths and hdisks. NMON_Analyser uses this information to construct the ESSBUSY, ESSRSIZE and ESSWSIZE sheets.
BBBG
The BBBG sheet contains details of the NMON disk group mappings.
BBBL
The BBBL sheet is only produced if the operating system is running in a partitions and contains details of the configuration of the LPAR at the start of the collection run.
BBBN
The BBBN describes each network adapter in the system and shows the name, speed and MTU size.
BBBP
The BBBP sheet contains the un-interpreted output from the emstat and lsattr commands. Note that to get output from these commands requires NMON to be running with root privileges.
The Analyser sets the sheet to use the fixed-pitch font specified on the NLS sheet (default Courier) in order to improve readability.
BBBR
This sheet records dynamic LPAR reconfiguration events during the collection run.
BBBV
This sheet lists all of the volume groups present at the start of the collection run.
CPUnnn
These sheets show %usr, %sys, %wait and %idle by time of day for each logical processor. Note that for micropartitions the Idle% and Wait% figures will include times when the physical processor was ceded to the shared pool.
NMON_Analyser generates a graph and a column headed “CPU%” containing the sum of %usr and %sys for use on the CPU_SUMM sheet. The Analyser also adds blank intervals for CPUs that are varied online during the collection interval so that the graphs cover the entire collection period.
If REORDER is set to YES on the Control sheet the Analyser will move all CPUnn sheets to the end of the file.
CPU_ALL
This sheet shows the average utilisation for all physical threads by time of day. Note that for micro-partitions CPU% is a measure of utilisation vs the entitlement but is adjusted by libperfstat so that it never exceeds 100%; this makes the numbers virtually useless for analysis of uncapped partitions and you may choose to look at the charts on the LPAR sheet instead. Note also that micro-partitions generally record very little Idle% or Wait% because they will normally cede their timeslice to other LPARs rather than waste CPU time waiting for work. If the CPUmax value is lower than the number of physical threads in use then the graph title will show the number of threads excluded.
The second graph shows the number of active CPUs by time of day and is useful in determining whether CPUs have been varied on/off during the collection period. If the system has SMT enabled then the Analyser shows logical CPUs rather than physical CPUs and the legend reports “SMT=ON”.
CPU_SUMM
The Analyser generates this sheet from data on the CPUnnn sheets. It gives a breakdown of CPU Utilisation by thread (logical processor) and by core over the collection period. The chart can be very useful in identifying situations in which the system is thread-starved (i.e. too few threads to fully utilise the logical processors) or where the workload is dominated by a small number of single-threaded processes.
Note that if CPUs have been dynamically reconfigured during the collection period, these figures reflect only those intervals when the CPU was varied on.
General notes for DISK, ESS, EMC, FASt and DG sheets
The DISK sheets record device statistics for each hdisk in the system. If there are more than <dpl> hdisks in the system (see "Collecting data using NMON" above) NMON generates multiple output sections. DISKBUSY will therefore contain device busy statistics for the first group of hdisks, DISKBUSY1 for the next, DISKBUSY2 for the next and so on.
The Analyser will normally sort the contents of the sheet in ascending sequence using the weighted average values as a sort key. However, if a storage subsystem is detected then sorting of the DISK sheets is disabled and the ESS/EMC/FASt/DG sheet contents are sorted instead.
If the number of hdisks (or vpaths) on the sheet exceeds the value specified for TOPDISKS (see “Analyser options” above), the graph will only show information for the specified number of disks and a warning will appear in the graph title.
If REORDER is set to YES on the Control sheet the Analyser will move all but the DISKBUSY, DISK_SUMM and DISKSERV sheets to the end of the file when a storage subsystem or Disk Group is detected. The rationale behind this being that the ESS/EMC/FASt/DG sheets contain the most useful data and that the DISK sheets merely replicate it. However, the DISKBUSY sheet is useful for checking the activity on system disks (normally local) and the DISK_SUMM sheet gives total data rates for the system (local + subsystem disks).
Note that NMON and NMON_Analyser can only handle a maximum of 250 vpaths in a system. If you have more than this then you need to use the Disk Groups feature of NMON to select the vpaths that are of primary interest.
EMC/PowerPath subsystems
NMON_Analyser detects the presence of an EMC/PowerPath subsystem by scanning the input file for the string “hdiskpower” before starting the analysis. EMC PowerPath creates devices called “hdiskpowern” which each map to multiple hdisks. They are therefore comparable to the vpaths generated by ESS/SDD. However, unlike vpaths, hdiskpower devices appear to AIX (and, therefore NMON) as real disks and NMON therefore records their activity on the DISK sheets.
NMON_Analyser removes all hdiskpower entries from DISK sheets and moves them to new sheets beginning with the letters EMC. For example, hdiskpower entries found on DISKBUSY1 are simply moved to a new sheet called EMCBUSY1. If a DISK sheet contains only hdiskpower devices, that sheet is simply renamed.
All device statistics reported by the Analyser (e.g. System I/O rates) are correct and as NMON excludes hdiskpower activity from the IOADAPT statistics these figures are also correct.
FAStT subsystems
NMON_Analyser detects the presence of a FAStT subsystem by scanning the input file for the string “dac” before starting the analysis. They are handled in the same way as EMC/PowerPath subsystems except that the dac devices are moved to sheets with names beginning "FASt".
Note that the Analyser is not able to correctly handle systems having both EMC and FASt subsystems.
DGBUSY
This sheet records the average value of device busy for each hdisk in the NMON Disk Group.
DGREAD
This sheet records the average data rate (Kbytes/sec) for read operations to each NMON Disk Group.
DGSIZE
This sheet records the average data transfer size (block size), in Kbytes, for read/write operations to each NMON Disk Group.
DGWRITE
This sheet records the average data rate (Kbytes/sec) for write operations to each NMON Disk Group.
DGXFER
This sheet records the total I/O operations per second to each NMON Disk Group.
DISKBSIZE
These sheets record the average data transfer size (block size), in Kbytes, for read/write operations on each hdisk in the system. If this number is not very close to the stripe size for the device there may be a problem that could be solved by increasing the value of numclust.
DISKBUSY
These sheets record device busy for each hdisk in the system. This is the same as the %tm_act value recorded by iostat. Note that if this sheet contains all zero values then it means you forgot to enable iostat collection before starting nmon:
chdev -l sys0 -a iostat=true
DISKREAD
These sheets record the data rate (Kbytes/sec) for read operations on each hdisk in the system.
DISKSERV
These sheets record the service times (in milliseconds) for read/write transfers to each hdisk in the system.
DISKWAIT
These sheets record the queue times (in milliseconds) for read/write transfers to each hdisk in the system.
DISKWRITE
These sheets record the data rate (Kbytes/sec) for write operations on each hdisk in the system.
DISKXFER
These sheets record the I/O operations per second for each hdisk in the system. This is the same as the tps value recorded by iostat.
DISK_SUMM
The Analyser creates this sheet. It shows the total data rates (reads and writes) in Kbytes/sec plus total I/O rates for all hdisks in the system. The figures on this sheet are accurate for all systems including ESS, EMC, FASt and HDS configurations.
These data are displayed on the chart; the IO/sec data are also graphically displayed on the AAA sheet.
DONATE
This sheet records physical processor usage and donation to the shared pool. Only present for dedicated LPARs running on POWER6 systems.
EMCBSIZE/FAStBSIZE
This sheet records the average data transfer size (blocksize), in Kbytes, for read/write operations to each esoteric device in a system using EMC/PowerPath or FAStT.
EMCBUSY/FAStBUSY
These sheets record device busy for each esoteric device in a system using EMC/PowerPath or FAStT.
EMCREAD/FAStREAD
These sheets record the data rate (Kbytes/sec) for read operations to each esoteric device in a system using EMC/PowerPath or FAStT.
EMCWRITE/FAStWRITE
This sheet records the data rate (Kbytes/sec) for write operations to each esoteric device in a system using EMC/PowerPath or FAStT.
EMCXFER/FAStXFER
These sheets record the I/O operations per second to each esoteric device in a system using EMC/PowerPath or FAStT.
EMCSERV/FAStSERV
The Analyser creates this sheet. It shows estimated services times (not response times) for each esoteric device over the collection interval. The service time is derived from the device busy and the transfer rate taken from the corresponding BUSY and XFER sheets. Intervals where the transfer rate is below SVCXLIM are ignored in order to improve the accuracy of the estimate.
ERROR
This sheet shows all errors reported by nmon during the collection run. FIRST/LAST intervals are ignored for this sheet. Timestamps are not converted to time values.
ESSBSIZE
This sheet is only present if ESS is set to YES and records the average data transfer size (blocksize), in Kbytes, for read/write operations on each vpath in the system. The data on this sheet are calculated by NMON_Analyser as the average of the DISKBSIZE values for component hdisks as recorded on the BBBE sheet.
ESSBUSY
This sheet is only present if ESS is set to YES and records device busy for each vpath in a system using ESS. The data on this sheet are calculated by NMON_Analyser as the average of the DISKBUSY values for component hdisks as recorded on the BBBE sheet.
ESSREAD
This sheet records the data rate (Kbytes/sec) for read operations on each vpath in the system. This information is provided by NMON.
ESSWRITE
This sheet records the data rate (Kbytes/sec) for write operations on each vpath in the system. This information is provided by NMON.
ESSXFER
These sheets record the I/O operations per second for each vpath in the system. This information is provided by NMON.
FCREAD
This sheet records the data rate (MBytes/sec) for read operations on each Fibre Channel adapter in the system.
FCWRITE
This sheet records the data rate (MBytes/sec) for write operations on each Fibre Channel adapter in the system.
FCXFERIN
This sheet records the read operations per second for each Fibre Channel adapter in the system.
FCXFEROUT
This sheet records the write operations per second for each Fibre Channel adapter in the system.
FILE
This sheet contains a subset of the fields reported by NMON on the Kernel Internal Statistics panel. These are the same values as reported by the sar command.
All fields are rates/sec.
iget translations of i-node numbers to pointers to the i-node structure of a file or device. This is reported as iget/s by the sar -a command. Calls to iget occur when a call to to namei has failed to find a pointer in the i-node cache. This figure should therefore be as close to 0 as possible.
namei calls to the directory search routine that finds the address of a v-node given a path name. This is reported as lookuppn/s by the sar -a command.
dirblk number of 512-byte blocks read by the directory search routine to locate a directory entry for a specific file. This is reported as dirblk/s by the sar -a command.
readch characters transferred by read system call. This is reported as rchar/s by the sar -c command
writech characters transferred by write system call. This is reported as wchar/s by the sar -c command.
ttyrawch tty input queue characters. This is reported as rawch/s by the sar -y command.
ttycanch tty canonical input queue characters. This field is always 0 (zero) for AIX Version 4 and later versions.
ttyoutch tty output queue characters. This is reported as outch/s by the sar -y command
NMON_Analyser produces two graphs - one showing rates/sec for readch and writech by time of day and one showing rates/sec for iget, namei and dirblk.
FRCA
This sheet is only generated if FRCA is loaded on the target system. NMON_Analyser produces a graph showing the cache hit ratio (as a percentage). If FRCA is not loaded, NMON generates no data and the Analyser consigns the redundant header record to the StrayLines sheet.
IOADAPT
For each I/O adapter listed on the BBBC sheet, contains the data rates for both read and write operations (Kbytes/sec) and total number of I/O operations performed. On AIX 5.1 and later, this information is reported by the iostat -A command. NMON_Analyser reorders the columns on the sheet for easier graphing.
The Analyser generates three graphs. Note the area charts can be easily converted to line charts if required. Simply right click on the white space within the chart area, then select Chart Type>Line>OK.
IP
This sheet only appears for topasout.
JFSFILE
For each file system, this sheet shows what percentage of the space allocation is being used during each interval. These figures are the same as the %Used value reported by the df command. The column headings show the mount point; sheet BBBC can be used to cross-reference to the file system/LV.
JFSINODE
For each file system, this sheet shows what percentage of the Inode allocation is being used during each interval. These figures are the same as the %Iused value reported by the df command. The column headings show the mount point; sheet BBBC can be used to cross-reference to the file system/LV.
LAN
This sheet only appears for topasout.
LARGEPAGE
The graph shows Usedpages and Freepages over time.
Columns on the sheet are as follows:
Freepages the number of large pages on the free list.
Usedpages the number of large pages currently in use.
Pages the number of large pages in the pool.
HighWater the maximum number of pages used since the last reboot.
SizeMB the size of a large page in Mbytes.
LPAR
The first graph shows the number of physical processors used by this partition vs the entitlement. For an uncapped partition the number of physical processors may exceed the entitlement but can never exceed the number of virtual processors allocated to the partition. For AIX the graph also shows the number of unfolded virtual processors (AIX will “fold” - stop dispatching work to - excess processors in order to minimise scheduling costs).
Note that the ratio of physical processor to entitlement (shown as %entc in the output of the lparstat command) will generally be higher than CPU% on the CPU_ALL sheet. The reason for this is that a partition that is within its entitlement may wait for a short period of time before ceding a processor that enters an I/O wait or becomes idle. This can eliminate unnecessary context switches.
The second graph shows CPU utilisation as a percentage of virtual processors – for AIX this is broken down in to usr%, sys% and wait%. This level of detail is not available for Linux or releases of NMON prior to version 12.
The third graph is only present for AIX systems and shows cpu utilisation of the shared pool by this and other partitions. The area marked “UsedPoolCPU%” represents the percentage of the shared pool that has been used by this partition, while the area marked “other% “ represents the percentage used by all other partitions. Note that if the partition is not authorised to see utilisation of the shared pool then the pool will appear to be 100% utilised.
Columns on the sheet are as follows:
PhysicalCPU physical cores consumed by AIX
VirtualCPUs number of Virtual CPUs allocated to the LPAR
logicalCPUs number of threads (i.e. Virtual CPUs multiplied by SMT mode)
poolCPUs number of cores in the pool that this LPAR occupies
entitled the number of cores guaranteed to be available to this LPAR
weight the priority of this LPAR when competing for unused CPU cycles
PoolIdle the number of unused cores in the Pool
usedAllCPU% percentage of active cores in the machine that this LPAR is using
usedPoolCPU percentage of cores in the pool that this LPAR is using
SharedCPU 1 if the LPAR is not a dedicated CPU
Capped 1 if the LPAR is capped
EC_User% percentage of Entitlement used in User mode
EC_Sys% percentage of Entitlement used in System mode
EC_Wait% percentage of Entitlement waiting for I/O
EC_Idle% percentage of Entitlement used in Idle mode
VP_User% percentage of Virtual CPU used in User mode
VP_Sys% percentage of Virtual CPU used in System mode
VP_Wait% percentage of Virtual CPU waiting for I/O
VP_Idle% percentage of Virtual CPU spent in Idle mode
Folded no. of Virtual CPUs unused for efficiency reasons
CPU_Pool_id the Id of the CPU pool, useful if there are multiple pools
MEM
The main graph on this sheet shows the amount of Real Free memory in Mbytes by time of day. This would be the same as dividing the fre values reported by vmstat over the same interval by 256. The small graph shows the amount of real memory. This is useful in determining if dynamic reconfiguration has been used during the collection period.
For AIX, other columns on the sheet are as follows:
Real Free the percentage of real pages on the free list.
Virtual Free the percentage of unallocated virtual slots on the paging spaces.
Real Free (MB) the amount of memory on the free list in Mbytes.
Virtual Free (MB) the amount of unallocated space on the paging spaces.
Real Total (MB) the total amount of memory available to AIX.
Virtual Total (MB) the total amount of space allocated for paging spaces.
Note: you can calculate the amount of memory used during an interval simply by subtracting the Real Free (MB) value from the Real Total (MB) value. This will, however, include file pages. The graph on the MEMUSE sheet gives a more accurate assessment of memory used by programs (computational pages).
MEMUSE
Except for %comp, the values on this sheet are the same as would be reported by the vmtune command.
%numperm the percentage of real memory allocated to file pages.
%minperm value specified on the vmtune command or system default of 20%. This will normally be constant for the run unless the vmtune or rmss commands are used during collection.
%maxperm value specified on the vmtune command or system default of 80%. This will normally be constant for the run unless the vmtune or rmss commands are used during collection.
minfree the minimum number of pages AIX is to keep on the free list. Specified on the vmtune command or system default of maxfree - 8.
maxfree the maximum number of pages AIX is steal in order to replenish the free list. Specified on the vmtune command or system default.
%comp The percentage of real memory allocated to computational pages. NMON_Analyser calculates this value. Computational pages are those backed by page space and include working storage and program text segments. They exclude data, executable and shared library files.
The Analyser generates two graphs. The first shows the split between computational and file pages by time of day. The second plots the values of %numperm, %minperm, %maxperm and %comp.
If %numperm falls below %minperm then computational pages will be stolen. If %numperm rises above %maxperm then computational pages cannot be stolen. Low values for both %minperm and %maxperm indicate that the system has been tuned for a database server. You may also want to check the setting of STRICT_MAXPERM on the BBBP sheet (if present).
MEMNEW
The graph shows the allocation of memory split into the three major categories: pages used by user processes, file system cache, and pages used by the system (kernel).
Process% the percentage of real memory allocated to user processes
FSCache% the percentage of real memory allocated to file system cache
System% the percentage of real memory used by system segments
Free% the percentage of unallocated real memory
User% the percentage of real memory used by non-system segments
MEMPAGES4K/64K/16MB/16GB
These sheets are only present for AIX. They show various statistics for different page sizes in use within the system. The Analyser will delete the sheets for pages sizes not currently in use.
For the MEMPAGES64KB sheet a graph is drawn showing the use of both 4KB and 64KB pages within the system – starting with AIX V6.1 (and supporting hardware) these page sizes are selected dynamically based on memory access patterns.
MEMREAL
This sheet only appears for topasout. The Analyser adds a column showing Real Free memory in Mbytes.
MEMVIRT
This sheet only appears for topasout.
NET
This sheet shows the data rates, in Kbytes/sec, for each network adapter in the system (including SP switch if present). This is the same as produced by the netpmon –O dd command. NMON_Analyser adds one column for each adapter showing the total data rate (read + write) and two columns showing Total Read and Total Write. Note that the Total Write is calculated as a negative number for graphing.
The Analyser generates three graphs. The first graph shows total network traffic broken down as Total-Read and Total-Write. The writes are shown below the X-Axis.
Note the area chart can be easily converted to a line chart if required. Simply right click on the white space within the chart area, then select Chart Type>Line>OK.
NETPACKET
This sheet shows the number of read/write network packets for each adapter. This is the same as produced by the netpmon –O dd command.
NETSIZE
This sheet shows the average packet size in bytes for each network adapter in the system.
NFS sheets
There are separate sheets for NFS2, NFS3 and NF4 client/server. The Analyser will delete empty sheets.
PAGE
This sheet has the paging statistics as recorded by NMON.
faults the number of page faults per second. This is not a count of page faults that generate I/O, because some page faults can be resolved without I/O.
pgin the total rate/sec of page-in operations to both paging space and file systems during the interval.
pgout the total rate/sec of page-out operations to both paging space and file systems during the interval.
pgsin the rate/sec of page-in operations from paging space during the interval. This is the same as the pi value reported by vmstat. If pgsin is consistently higher than pgsout this may indicate thrashing.
pgsout the rate/sec of page-out operations to paging space during the interval. This is the same as the po value reported by vmstat.
reclaims from NMON 10 onwards this field is the same as the fr value reported by vmstat and represents the number of pages/sec freed by the page-replacement routine.
scans the number of pages/sec examined by the page replacement routine. This is the same as the sr value reported by vmstat. Page replacement is initiated when the number of free pages falls below minfree and stops when the number of free pages exceeds maxfree.
cycles the number of times/sec the page replacement routine had to scan the entire Page Frame Table in order to replenish the free list. This is the same as the cy value reported by vmstat but note that vmstat reports this number as an integer whereas nmon reports it as a real number.
fsin calculated by the Analyser as pgin-pgsin for graphing
fsout calculated by the Analyser as pgout-pgsout for graphing
sr/fr calculated by the Analyser as scans/reclaims for graphing
NMON_Analyser produces two graphs. The first shows paging operations to/from paging space. The ideal here would be no more than 5 operations/sec per page space (see the BBBC sheet for details). The second graph shows the scan:free rate. Memory may be over-committed when this figure is >4 although you also need to examine the MEM and PAGE sheets as well.
POOLS
This sheet contains information about the shared pool in which the LPAR is running. Most of the data will only be present if “Allow performance information collection.” is set in the LPAR properties.
shcpus_in_sys the number of cores allocated to the global shared pool
max_pool_capacity the maximum number of VPs defined for this pool
entitled_pool_capacity the entitlement for this pool (includes reserve entitlement)
pool_max_time same as max_pool_capacity but may vary in value if the pool definition is changed during the collection run.
pool_busy_time the average number of cores in use by this shared pool during the interval
shcpu_tot_time the average number of cores available to the global shared pool (including shared dedicated resources?) during the interval
shcpu_busy_time the average number of core in use within the global shared pool
pool_id this identifier of this pool
entitled the entitlement of this LPAR
PROC
This sheet contains a subset of the fields reported by NMON on the Kernel Internal Statistics panel. The RunQueue and Swap-in fields are average values for the interval. All other fields are rates/sec:
RunQueue the average number of kernel threads in the run queue. This is reported as runq-sz by the sar -q command and is reported as RunQueue on the nmon Kernel Internal Statistics panel. A value that exceeds 3x the number of CPUs may indicate CPU constraint.
Swap-in the average number of kernel threads waiting to be paged in. This is reported as swpq-sz by the sar -q command.
pswitch the number of context switches. This is reported as pswch/s by the sar -w command.
syscall the total number of system calls. This is reported as scall/s by the sar -c command.
read the number of read system calls. This is reported as sread/s reported by the sar -c command.
write the number of write system calls. This is reported as swrit/s by the sar -c command.
fork the number of fork system calls. This is reported as fork/s by the sar -c command.
exec the number of exec system calls. This is reported as exec/s by the sar -c command.
rcvint the number of tty receive interrupts. This is reported as revin/s by the sar -y command.
xmtint the number of tty transmit interrupts. This is reported as xmtin/s by the sar -y command.
sem the number of IPC semaphore primitives (creating, using and destroying). This is reported as sema/s by the sar -m command.
msg the number of IPC message primitives (sending and receiving). This is reported as msg/s by the sar -m command.
NMON_Analyser produces three graphs - one showing the average length of the RunQueue and the number of swap-ins by time of day, another showing rates/sec for pswitch and syscalls by time of day and a third showing rates/sec for forks and execs.
The graph for forks/execs can be useful when monitoring web server systems.
PROCAIO
This sheet contains information about the number of asynchronous I/O processes available and active (i.e. using more than 0.1% of the CPU) . It also shows the amount of CPU being used by the AIO processes during the collection interval.
Two graphs are produced. The second uses two y-axes. The number of running aio processes is shown against the first axis and the amount of cpu used is shown against the second.
RAWCPUTOTAL, RAWLPAR
These sheets contain a dump of various counters such as context switches and phantom interrupts.
TCPUDP
This sheet only appears for topasout.
TOP
This sheet is only generated if you specify the -t flag on the NMON command line. The output is similar to that produced using the ps v command. Note that, because of the limitation of having only 65,000 lines on a single sheet, some data may be omitted for very large files and this may mean that entire PIDs or even commands may be missing from the analysis.
Note that data are only present for processes that consumed a significant amount of CPU during an interval. The TOP sheet does not represent a complete view of the system.
NMON_Analyser does the following:
? reorders the columns for easier processing.
? Sorts the data on the sheet into COMMAND name order - using TIME as a minor sort key.
? Creates a table at the end of the sheet summarising the data by command name and used for graphing.
You can see the detail section by scrolling to the top of the sheet. The summary table is largely obscured by the graphs and so you will need to move (or delete) them for easier viewing.
PID in the detail section this is the process ID of a specific invocation of a command. In the summary table this is the command name.
%CPU in the detail section this is the utilisation of a single processor (rather than of the system) by that PID during the interval. In the summary table this is the average amount of CPU used by all invocations of the command during the collection period.
%Usr in the detail section this is the average amount of User-mode CPU used by that PID during the interval.
%Sys in the detail section this is the average amount of Kernel-mode CPU used by that PID during the interval.
Threads the number of (software) threads being used by this command.
Size the average amount of paging space (in Kbytes) allocated for the data section (private segment + shared library data pages) for one invocation of this command. This is the same as the SIZE figure on the ps v command. Note that if Size is greater than ResData it means some working segment pages are currently paged out.
ResText the average amount of real memory (in Kbytes) used for the code segments of one invocation of this command. Note that multiple concurrent invocations will normally share these pages.
ResData the average amount of real memory (in Kbytes) used for the data segments of one invocation of this command. A method of calculating real memory usage for a command is ResText + (ResData * N).
CharIO this is the count of bytes/sec being passed via the read and write system calls. The bulk of this is reading and writing to disks but also includes data to/from terminals, sockets and pipes. Use this to work out which processes are doing the I/O.
%RAM this is an indication of what percentage of real memory this command is using. This is (ResText + ResData) / Real Mem; it is the same as the %MEM value on the
ps v command. Due to rounding/truncation, and the large amounts of memory in modern systems, this is usually 0.
Paging sum of all page faults for this process. Use this to identify which process is causing paging but note that the figure includes asynchronous I/O and can be misleading.
Command name of the command
WLMClass name of the Workload Partition or Workload Manager superclass to which this command has been allocated (64-bit kernel only).
IntervalCPU generated by the Analyser. In the detail section this shows the total amount of CPU used by all invocations of a command in the time interval. It is calculated as the sum of CPU used by all PIDS running the same command divided by the number of active processors (physical cores) available during the interval. In the summary section this is broken down as Average, Weighted Average and Maximum and is used to generate the graph.
WSet generated by the Analyser. In the detail section this shows the total amount of memory used by all invocations of a command recorded in the time interval. It is calculated as ResText + (ResData * N) (where “N” is the number of copies of this command running concurrently during the interval). In the summary section this is broken down as Minimum, Average and Maximum and is used to generate the graph.
User generated by the Analyser if a UARG sheet is present. This contains the name of the user running the process.
Arg generated by the Analyser if a UARG sheet is present. This contains the complete argument string entered for the command.
The Analyser generates four graphs using data in the generated table:
? A graph showing Average, Weighted Average and Maximum CPU Utilisation by command
? A graph showing Minimum, Average and Maximum Memory Utilisation by command
? A graph showing Average, Weighted Average and Maximum CHARIO by command
? A graph showing the CPU utilisation for each PID for each interval as a scatter chart. Note that this chart is only produced if there are fewer than 32,000 lines on the TOP sheet. See below for notes on interpreting this chart.
Interpreting the %Processor by PID chart
The purpose of the chart is to provide a link to the UARG sheet so that you can discover precisely which invocation of a command was responsible for using the CPU. It shows the processor utilisation (utilisation of a single CPU) by each PID captured on the TOP sheet. Note that a process can use more than 100% of a single CPU if it is multi-threaded.
Active PIDs will create a cluster of points on the chart. The highest point will show the maximum amount of CPU used during any one snapshot. To find out which PID a point refers to, move the mouse to position the cursor above it and Excel will display a coordinate pair. The first coordinate is the PID – use this to refer to the UARG sheet to find precisely which command was being executed.
UARG
This sheet has the first 1,000 commands executed during the collection period. The commands are listed in time order. Note that commands appearing in the first interval may have been executing prior to the start of the collection.
PID the process ID of a specific invocation of a command
PPID the parent process ID
COMM the command being executed
THCOUNT the number of threads started by this process
USER the name of the user running this process
GROUP the name of the group to which the user belongs
FullCommand the full command string entered by the user
VM
This sheet is only present for Linux systems and contains a dump of the /proc/vmstat file values.
The two graphs shows file-backed paging (pgpgin/pgpgout) and swap space activity.
WPAR sheets
These sheets are only present for AIX V6 and record data for each Workload Partition in the system. They are not currently generated by the topas version of nmon.
WLM sheets
Contain details of CPU, Memory and I/O bandwidth used by each Superclass/Subclass defined to WLM during the collection run. The Analyser will extract subclasss data and create a new set of sheets for each class with more than one subclass. These sheets will be named “WLMCPU.class” etc.
If this is a Micro-partition then the Analyser will also create a set of WLMPCPU sheets which will show the physical processor utilisation rather than %CPU utilisation.
ZZZZ
The Analyser uses the information on this sheet to automatically convert all NMON time stamps to actual time of day for easier analysis. For NMON10 or later a column is added which contains the date and time as a single value and this is used for the conversions. The number of rows on this sheet is used by the Analyser to reset the “snapshots” value on the AAA sheet in case the nmon run was terminated with SIGUSR2.
Error Handling
Error handling in NMON_Analyser is rudimentary. The Analyser can handle many input file errors, but occasionally the analysis will halt leaving you staring at a dialog box. Should this happen, please accept my apologies. However, before sending me a copy of the input file, please read the following:
Common problems
The most commonly reported problems arise from invalid input files. We also get problems reported where, for whatever reason, lines have been truncated, split or even duplicated. NMON_Analyser attempts to trap these errors and will report them on the “StrayLines” sheet. Check this sheet if the run stops unexpectedly.
? 'No valid input! NMON run may have failed.'
The most common cause of this message is that the NMON run failed and there really is no valid input. NMON initialises the output file by writing all of the section headings. If it subsequently fails, you will get an output file that consists purely of headings - with no data. Check the file by loading it into a word processor or, indeed, a spreadsheet (as a .csv file) before you send it to me.
? 'Unexpected end of file.'
This is only reported when processing files containing more lines than can be stored on one sheet and when SORTINP is set to NO. It is usually caused by the fact that lines are being terminated with a CR character instead of CRLF. Change your FTP option to ASCII or TEXT when sending the file to your PC. This problem only shows up with large files because the Analyser uses a different technique to read them than that used to read smaller files.
Strangely, one of the most common problems I get is caused by the fact that the Analyser can’t handle files with a single data interval very well. If you want to test the package just let NMON run for a few minutes to get a reasonable data sample!
Known bugs/problems (V3.4, topas_nmon)
? When analysing systems with a very large number of disks, Excel can stop with error “No more fonts can be added” or “Insufficient Resources”. Set GRAPHS to LIST and select only those sheets you are interested in using the LIST option on the Settings sheet.
? The data can be sorted incorrectly with some versions of nmon (notably 14g) which generate variable length timestamps. Process each file separately and specify MERGE=YES to get the data sorted correctly.
? The PIVOT option does not seem to work with Excel 2007 or later
? The Analyser will crash if you edit the .csv file using Excel prior to the run and the file contains a TOP section. If you need to edit the input file, use a word processor.
? There are some issues with processing files from systems having both ESS and EMC subsystems attached.
? When analysing ESS subsystems with more than 253 vpaths some vpath data will be missing from the output. Use NMON Disk Groups to combine several vpaths into a single unit for reporting and use the –E flag to prevent the ESS sections from being produced. Alternatively, set ESS to NO on the Control sheet and ignore warning messages about data truncation – only the first 253 vpaths will appear in the output.
How to report a problem
Post the relevant information on the nmon forum (see the link in the introduction). It can help to include a copy of the original, unmodified .nmon input file, plus the incomplete output spreadsheet, as a compressed (zipped) file but please consider your system security before doing so.
If you have the ability to capture a screenshot then a copy of any dialog boxes also proves useful on occasion.
Note: Development is currently done on Microsoft Excel 2003 (11.8320.8221) SP3. It may not be possible to fix problems arising from the use of different releases.
Excel/VBA Resources/Links
This is a good source for Excel tips and it has some VBA examples as well:
http://exceltips.vitalnews.com/
This is the home of an excellent reference book:
And of course
Appendix: Notes on Batch Operation
If you regularly process large numbers of files, the operation of NMON_Analyser can be completely automated. Simply create a text file containing a list of nmon file names (using wild card characters as appropriate) and enter the name of this file into the FILELIST field of the Analyser control sheet. Specify the name of an existing directory in the OUTDIR field if you want all of the output files to end up in one place. Save the NMON_Analyser spreadsheet under a new name (this is recommended so that you can still use NMON_Analyser for interactive sessions).
Now create Windows .bat files to invoke Excel (see the samples below).
After processing the last input file, the Analyser will automatically close down Excel. Note, however, that this only happens if you load a copy of the Analyser that has a saved FILELIST name and if there are no other open spreadsheets. This allows you to use the FILELIST option safely during an interactive session.
Sample .bat files
These sample batch control files are designed to use the pscp file from the PuTTY suite written and maintained by Simon Tatham at http://www.chiark.greenend.org.uk/~sgtatham/putty/
My thanks to Jamie Dennis for providing them.
getcsv.bat
cd \NMON\RawData
del *.csv
d:\progra~1\putty\pscp -p -r -l userid host://Performance/NMON/Rawdata/*.csv .
analyser.bat
D:
cd \NMON\FinishedData
del d:\NMON\FinishedData\*.xls
"D:\NMON\nmon analyser batch.xls"
putxls.bat
D:
cd \NMON\FinishedData
d:\progra~1\putty\pscp -p -r -l userid *.xls host:/Performance/NMON/
Control.txt
d:\NMON\RawData\*.csv
NMON Analyser Batch.xls
| OUTDIR |
d:\NMON\FinishedData\ |
| FILELIST |
d:\NMON\FinishedData\Control.txt |
About Me
...............................................................................................................................
● 本文整理自网络
● 本文在itpub(http://blog.itpub.net/26736162)、博客园(http://www.cnblogs.com/lhrbest)和个人微信公众号(xiaomaimiaolhr)上有同步更新
● 本文itpub地址:http://blog.itpub.net/26736162/abstract/1/
● 本文博客园地址:http://www.cnblogs.com/lhrbest
● 本文pdf版及小麦苗云盘地址:http://blog.itpub.net/26736162/viewspace-1624453/
● 数据库笔试面试题库及解答:http://blog.itpub.net/26736162/viewspace-2134706/
● QQ群:230161599 微信群:私聊
● 联系我请加QQ好友(646634621),注明添加缘由
● 于 2017-07-01 09:00 ~ 2017-07-31 22:00 在魔都完成
● 文章内容来源于小麦苗的学习笔记,部分整理自网络,若有侵权或不当之处还请谅解
● 版权所有,欢迎分享本文,转载请保留出处
...............................................................................................................................
拿起手机使用微信客户端扫描下边的左边图片来关注小麦苗的微信公众号:xiaomaimiaolhr,扫描右边的二维码加入小麦苗的QQ群,学习最实用的数据库技术。