原文 http://blog.csdn.net/lixuekun820/article/details/5485042
Summary:
Adobe 的 Flex Chart提供了很强大的功能,通过简单的设置就可以实现一些较复杂的效果。比如通过ColumnSet将多个柱状图以overlaid形式显示,并添加条线图。但思想是无止境的,老外要求我们在柱状图上有斜线的效果等。
Requirement:
ColumnChart 的能够显示线条,不同的柱状图显示不同的倾斜度、粗细及颜色。
Solution:
自定义ColumnSeries的itemRenderer.
定义 LinesRenderer.as 如下:
package
{
import flash.display.Graphics;
import flash.geom.Point;
import mx.charts.renderers.BoxItemRenderer;
public class LinesRenderer extends BoxItemRenderer
{
/**
* properties:
* lineGap is the gap between in lines
* lineAngle is line's angle
* */
public var lineGap : Number=4;
public var lineAngle : Number = 75;
/**
* style settings:
* linethickness
* lineColor
* lineAlpha
* */
public var lineThickness : Number = 1;
public var lineColor : uint = 0x000000;
public var lineAlpha : Number = 1;
/**
* Private properties:
* xIncreace: x add value
* yIncreace: y add value
* maxIncreace: the max value of increace
*
* */
private var xIncreace : Number;
private var yIncreace : Number;
private var maxIncreace : Number;
private static const RADIAN_UINT : Number = Math.PI / 180;
private var startPoint : Point = new Point(0, 0);
private var endPoint : Point = new Point(0, 0);
private var currentPoint : Point = new Point(0, 0);
public function LinesRenderer()
{
super();
}
override protected function updateDisplayList(unscaledWidth:Number, unscaledHeight:Number):void
{
super.updateDisplayList(unscaledWidth, unscaledHeight);
if (this.height == 0 || this.width == 0)
{
return;
}
var g:Graphics=graphics;
g.lineStyle(lineThickness, lineColor, lineAlpha);
drawShadeLine(g);
g.endFill();
}
/**
* draw lines function
**/
private function drawShadeLine(g : Graphics) : void
{
var absHeight : Number = Math.abs(height);
var absWidth : Number = Math.abs(width);
currentPoint.x = 0;
currentPoint.y = 0;
if(lineAngle == 0)
{
if(height < 0)
{
currentPoint.y = - absHeight;
}
for(var i : int = 1; i * lineGap < absHeight; i++)
{
g.moveTo(currentPoint.x, currentPoint.y + i * lineGap);
g.lineTo(currentPoint.x + absWidth, currentPoint.y + i * lineGap);
}
}
else if(lineAngle == 90)
{
if(height < 0)
{
currentPoint.y = - absHeight;
}
for(var t : int = 1; t * lineGap < absHeight; t++)
{
g.moveTo(currentPoint.x + t * lineGap, currentPoint.y);
g.lineTo(currentPoint.x + t * lineGap, currentPoint.y + absHeight);
}
}
else if(lineAngle > 0 && lineAngle < 90)
{
if(height < 0)
{
currentPoint.y = - absHeight;
}
xIncreace = lineGap / Math.cos(lineAngle * RADIAN_UINT);
yIncreace = lineGap / Math.sin(lineAngle * RADIAN_UINT);
maxIncreace = Math.max(absHeight + absWidth/Math.tan(lineAngle * RADIAN_UINT)
,absWidth + absHeight * Math.tan(lineAngle * RADIAN_UINT));
for (var j:int = 1; (j * xIncreace < maxIncreace || j * yIncreace < maxIncreace); j++)
{
startPoint.y = currentPoint.y + j * yIncreace;
if (startPoint.y > currentPoint.y + absHeight)
{
startPoint.x = Math.min((startPoint.y - currentPoint.y - absHeight) * Math.tan(lineAngle * RADIAN_UINT),
currentPoint.x + absWidth);
startPoint.y = currentPoint.y + absHeight;
} else
{
startPoint.x = currentPoint.x;
}
endPoint.x = currentPoint.x + j * xIncreace;
if (endPoint.x > currentPoint.x + absWidth)
{
endPoint.y = Math.min(currentPoint.y + (endPoint.x - currentPoint.x - absWidth)/Math.tan(lineAngle * RADIAN_UINT),
currentPoint.y + absHeight);
endPoint.x = currentPoint.x + absWidth;
} else
{
endPoint.y = currentPoint.y;
}
g.moveTo(startPoint.x, startPoint.y);
g.lineTo(endPoint.x, endPoint.y);
}
}
else if(lineAngle > 90 && lineAngle < 180)
{
if(height > 0)
{
currentPoint.y = height;
}
xIncreace = lineGap / Math.sin((180 - lineAngle) * RADIAN_UINT);
yIncreace = lineGap / Math.cos((180 - lineAngle) * RADIAN_UINT);
maxIncreace = Math.max(absHeight + absWidth * Math.tan((180 - lineAngle) * RADIAN_UINT)
,absWidth + absHeight / Math.tan((180 - lineAngle) * RADIAN_UINT));
for (var k:int = 1; (k * xIncreace < maxIncreace || k * yIncreace < maxIncreace); k++)
{
startPoint.y = currentPoint.y - k * yIncreace;
if (startPoint.y < currentPoint.y - absHeight)
{
startPoint.x = Math.min(Math.abs(currentPoint.y - absHeight - startPoint.y) / Math.tan((180 - lineAngle) * RADIAN_UINT),
currentPoint.x + absWidth);
startPoint.y = currentPoint.y - absHeight;
} else
{
startPoint.x = currentPoint.x;
}
endPoint.x = currentPoint.x + k * xIncreace;
if (endPoint.x > currentPoint.x + absWidth)
{
endPoint.y = Math.max(currentPoint.y - ((endPoint.x - currentPoint.x - absWidth) * Math.tan((180 - lineAngle) * RADIAN_UINT)),
currentPoint.y - absHeight);
endPoint.x = currentPoint.x + absWidth;
} else
{
endPoint.y = currentPoint.y;
}
g.moveTo(startPoint.x, startPoint.y);
g.lineTo(endPoint.x, endPoint.y);
}
}
}
}
}
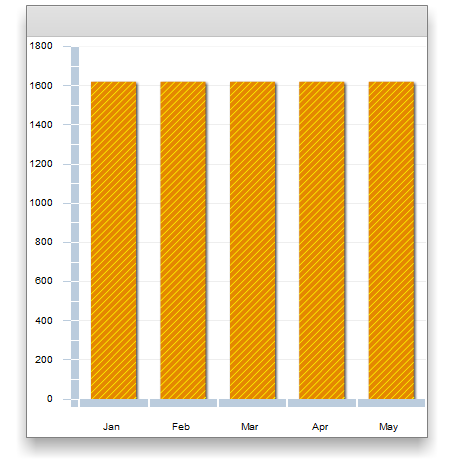
Example: 创建一个App,使ColumnSeries 的ItemRender 为linesRender
ColumnChartApp.mxml
<?xml version="1.0" encoding="utf-8"?>
<mx:Application xmlns:mx="http://www.adobe.com/2006/mxml" xmlns:local="*">
<mx:Script>
import mx.collections.ArrayCollection;
[Bindable]
public var dataCollection:ArrayCollection = new ArrayCollection([
{Month: "Jan", Income: 2000, AverageIncome:1620 },
{Month: "Feb", Income: 600, AverageIncome:1620},
{Month: "Mar", Income: 1500,AverageIncome:1620},
{Month: "Apr", Income: 2500, AverageIncome:1620},
{Month: "May", Income: 1500, AverageIncome:1620}]);
</mx:Script>
<mx:Panel>
<mx:ColumnChart id="myChart" dataProvider="{dataCollection}"
showDataTips="true" type="overlaid">
<mx:horizontalAxis>
<mx:CategoryAxis dataProvider="{dataCollection}"
categoryField="Month"/>
</mx:horizontalAxis>
<mx:series>
<mx:ColumnSeries xField="Month" yField="AverageIncome" displayName="Average"
>
<mx:itemRenderer>
<mx:Component>
<local:LinesRenderer lineAngle="45" lineGap="5" lineColor="0xffff00"/>
</mx:Component>
</mx:itemRenderer>
</mx:ColumnSeries>
</mx:series>
</mx:ColumnChart>
</mx:Panel>
</mx:Application>
注:代码可以独立运行,LinesRenderer.as 中的drawShadeLine()算法不是很理想,有待于改进。