actuator 通过暴露一系列的endpoints可以让开发者快速了解spring boot的各项运行指标,比如:线程数,jvm剩余内存等一系列参数。
启用方法很简单,参考下面:
dependencies {
    compile('org.springframework.boot:spring-boot-starter-thymeleaf')
    compile('org.springframework.boot:spring-boot-devtools')
    compile('org.springframework.boot:spring-boot-starter-actuator')
    compile('org.springframework.boot:spring-boot-starter-test')
    compileOnly('org.projectlombok:lombok')
}
关键是添加spring-boot-starter-actuator依赖项即可,下表是actuator提供的endpoints列表(从官网文档上抄过来的)
| ID | Description | Sensitive Default |
|---|---|---|
|
|
Provides a hypermedia-based “discovery page” for the other endpoints.Requires Spring HATEOAS to be on the classpath. |
true |
|
|
Exposes audit events information for the current application. |
true |
|
|
Displays an auto-configuration report showing all auto-configuration candidates and the reason why they ‘were’ or ‘were not’ applied. |
true |
|
|
Displays a complete list of all the Spring beans in your application. |
true |
|
|
Displays a collated list of all |
true |
|
|
Performs a thread dump. |
true |
|
|
Exposes properties from Spring’s |
true |
|
|
Shows any Flyway database migrations that have been applied. |
true |
|
|
Shows application health information (when the application is secure, a simple ‘status’ when accessed over an unauthenticated connection or full message details when authenticated). |
false |
|
|
Displays arbitrary application info. |
false |
|
|
Shows and modifies the configuration of loggers in the application. |
true |
|
|
Shows any Liquibase database migrations that have been applied. |
true |
|
|
Shows ‘metrics’ information for the current application. |
true |
|
|
Displays a collated list of all |
true |
|
|
Allows the application to be gracefully shutdown (not enabled by default). |
true |
|
|
Displays trace information (by default the last 100 HTTP requests). |
true |
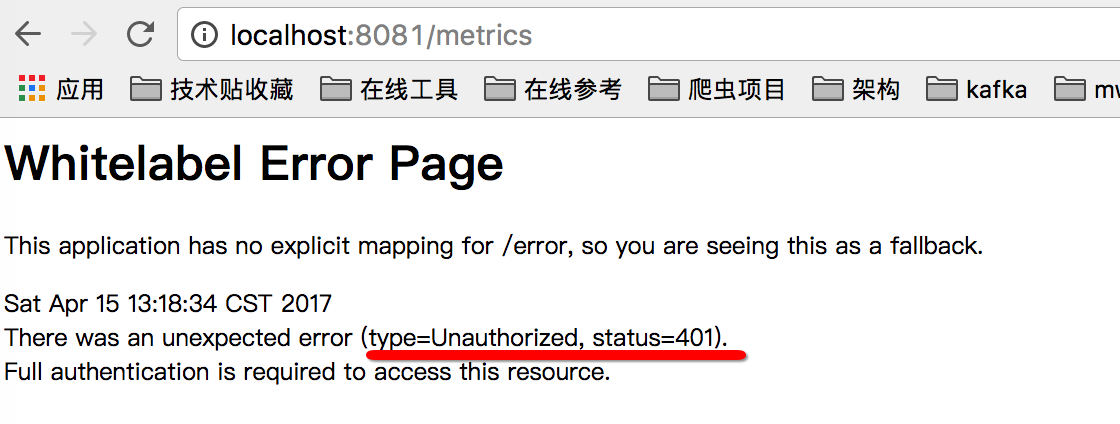
这张表中,有很多信息其实是敏感信息,并不适合匿名访问(特别是在公网环境下),所以默认情况下,如果想访问类似 http://localhost:8081/metrics 会看到以下错误:
比较好的做法是,将这些endpoints的端口,包括访问路径与常规应用的端口分开,application.yml可以参考下面的配置:
server:
  port: 8081
spring:
  main:
    banner-mode: "off"
  devtools:
    restart:
      trigger-file: .trigger
  thymeleaf:
    cache: false
management:
  security:
    enabled: false #关掉安全认证
  port: 1101 #管理端口调整成1101
  context-path: /admin #actuator的访问路径
如果在公网环境,建议在防火墙上做下限制,仅允许8081进来,1101用于内网访问即可,这样相对比较安全,也不用繁琐的输入密码。
访问下http://localhost:1101/admin/metrics 可以看到类似以下输出:
{
	mem: 466881,
	mem.free: 289887,
	processors: 4,
	instance.uptime: 10947,
	uptime: 18135,
	systemload.average: 3.12646484375,
	heap.committed: 411648,
	heap.init: 131072,
	heap.used: 121760,
	heap: 1864192,
	nonheap.committed: 56192,
	nonheap.init: 2496,
	nonheap.used: 55234,
	nonheap: 0,
	threads.peak: 27,
	threads.daemon: 19,
	threads.totalStarted: 32,
	threads: 22,
	classes: 6755,
	classes.loaded: 6755,
	classes.unloaded: 0,
	gc.ps_scavenge.count: 8,
	gc.ps_scavenge.time: 136,
	gc.ps_marksweep.count: 2,
	gc.ps_marksweep.time: 193,
	httpsessions.max: -1,
	httpsessions.active: 0
}
jvm的内存,cpu核数,线程数,gc情况一目了然。其它指标大概含义如下(网上抄来的)
系统信息:
包括处理器数量processors、运行时间uptime和instance.uptime、系统平均负载systemload.average。
mem.*:
内存概要信息,包括分配给应用的总内存数量以及当前空闲的内存数量。这些信息来自java.lang.Runtime。
heap.*:
堆内存使用情况。这些信息来自java.lang.management.MemoryMXBean接口中getHeapMemoryUsage方法获取的java.lang.management.MemoryUsage。
nonheap.*:
非堆内存使用情况。这些信息来自java.lang.management.MemoryMXBean接口中getNonHeapMemoryUsage方法获取的java.lang.management.MemoryUsage。
threads.*:
线程使用情况,包括线程数、守护线程数(daemon)、线程峰值(peak)等,这些数据均来自java.lang.management.ThreadMXBean。
classes.*:
应用加载和卸载的类统计。这些数据均来自java.lang.management.ClassLoadingMXBean。
gc.*:
垃圾收集器的详细信息,包括垃圾回收次数gc.ps_scavenge.count、垃圾回收消耗时间gc.ps_scavenge.time、标记-清除算法的次数gc.ps_marksweep.count、标记-清除算法的消耗时间gc.ps_marksweep.time。这些数据均来自java.lang.management.GarbageCollectorMXBean。
httpsessions.*:
Tomcat容器的会话使用情况。包括最大会话数httpsessions.max和活跃会话数httpsessions.active。该度量指标信息仅在引入了嵌入式Tomcat作为应用容器的时候才会提供。
gauge.*:
HTTP请求的性能指标之一,它主要用来反映一个绝对数值。比如上面示例中的gauge.response.hello: 5,它表示上一次hello请求的延迟时间为5毫秒。
counter.*:
HTTP请求的性能指标之一,它主要作为计数器来使用,记录了增加量和减少量。如上示例中counter.status.200.hello: 11,它代表了hello请求返回200状态的次数为11
结合其它一些工具把这些信息采集到grafana里,就有得到一系列很实用的监控图表数据,比如: 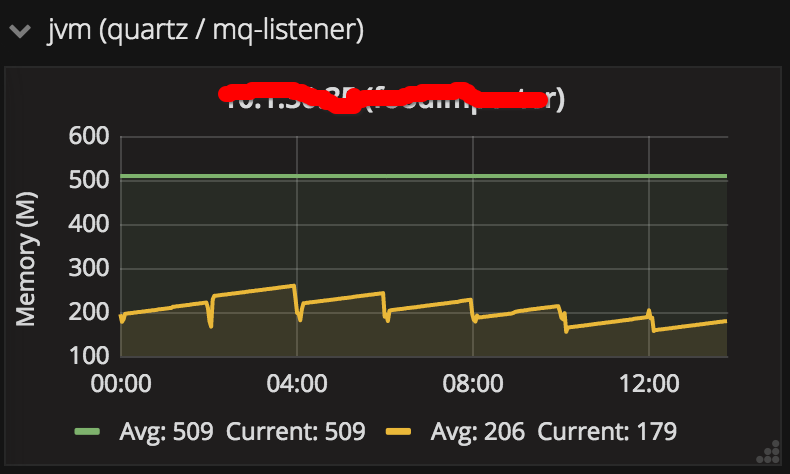
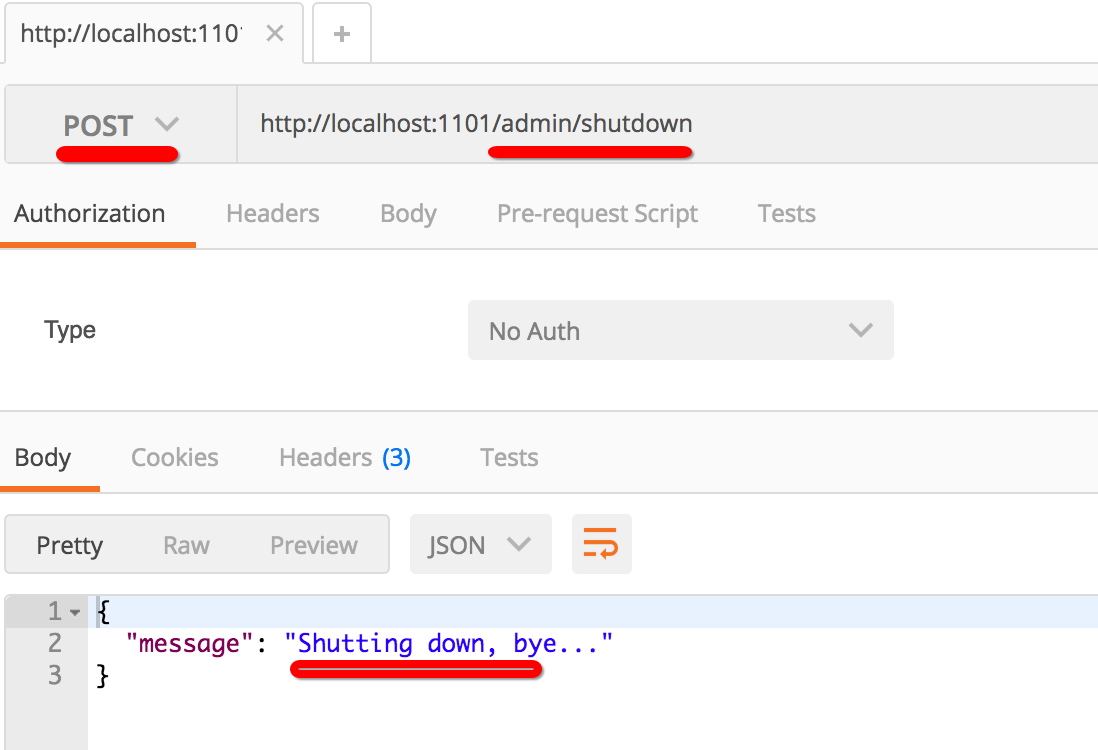
其它endpoint,就不一一展示了,大家有兴趣可以自行研究,最后要提一下的是shutdown这个endpoint,它可以实现优雅停机,这在线上部署时很有用,发布前先调用这个url,让应用优雅停掉,再部署新的代码,这样就不会导致正在处理的请求被中断,不过默认该功能是关闭的,可参考下面的设置启用:
endpoints:
  shutdown:
    enabled: true
而且出于安全考虑,该url只能以post方式访问,下图是用postman模拟post访问 http://locahost:1101/admin/shutdown的效果:
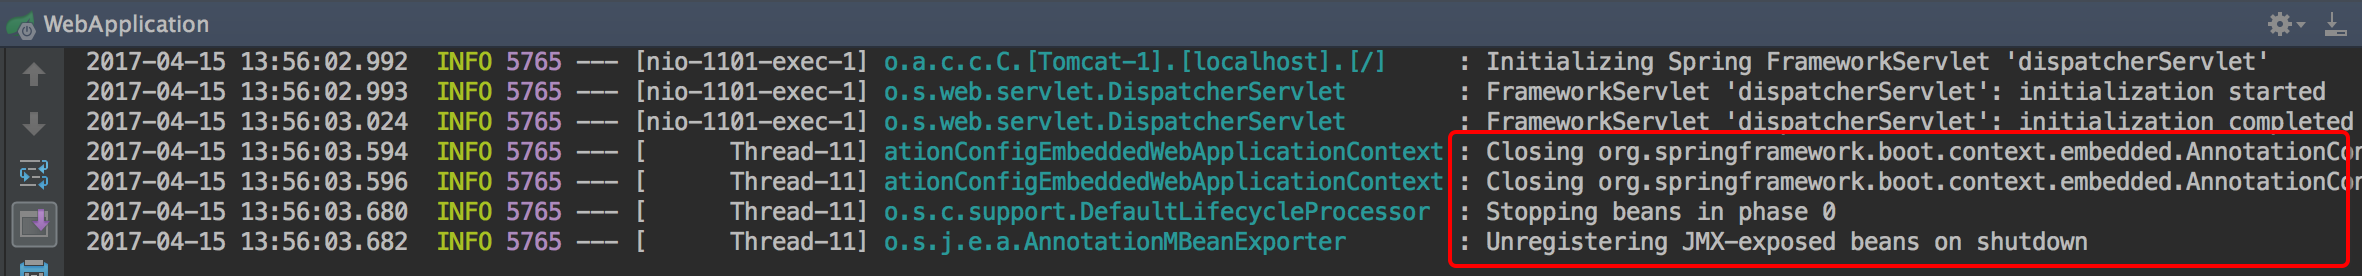
同时在日志里也能看到应用确实被关闭:
参考文章:
http://docs.spring.io/spring-boot/docs/current/reference/htmlsingle/#production-ready