perf是基于内核子系统的一个性能分析框架,包括硬件层面(cpu/pmu)和软件级的性能分析。
man perf
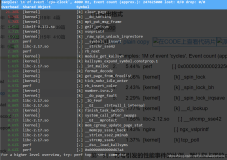
分类列出可以跟踪的事件
PERF(1)                           perf Manual                          PERF(1)
NAME
       perf - Performance analysis tools for Linux

SYNOPSIS
       perf [--version] [--help] COMMAND [ARGS]

DESCRIPTION
       Performance counters for Linux are a new kernel-based subsystem that provide a framework for all things performance analysis. It covers hardware level (CPU/PMU, Performance Monitoring Unit) features and
       software features (software counters, tracepoints) as well.
SEE ALSO
       perf-stat(1), perf-top(1), perf-record(1), perf-report(1), perf-list(1)
分类列出可以跟踪的事件
perf list [...]
例如
perf可以用的命令
每个命令的帮助
       1.  hw or hardware to list hardware events such as cache-misses, etc.

        2.  sw or software to list software events such as context switches, etc.

        3.  cache or hwcache to list hardware cache events such as L1-dcache-loads, etc.

        4.  tracepoint to list all tracepoint events, alternatively use subsys_glob:event_glob to filter by tracepoint subsystems such as sched, block, etc.
例如
#perf list hw
  cpu-cycles OR cycles                               [Hardware event]
  stalled-cycles-frontend OR idle-cycles-frontend    [Hardware event]
  stalled-cycles-backend OR idle-cycles-backend      [Hardware event]
  instructions                                       [Hardware event]
  cache-references                                   [Hardware event]
  cache-misses                                       [Hardware event]
  branch-instructions OR branches                    [Hardware event]
  branch-misses                                      [Hardware event]
  bus-cycles                                         [Hardware event]

#perf list sw
  cpu-clock                                          [Software event]
  task-clock                                         [Software event]
  page-faults OR faults                              [Software event]
  minor-faults                                       [Software event]
  major-faults                                       [Software event]
  context-switches OR cs                             [Software event]
  cpu-migrations OR migrations                       [Software event]
  alignment-faults                                   [Software event]
  emulation-faults                                   [Software event]

#perf list cache
  L1-dcache-loads                                    [Hardware cache event]
  L1-dcache-load-misses                              [Hardware cache event]
  L1-dcache-stores                                   [Hardware cache event]
  L1-dcache-store-misses                             [Hardware cache event]
  L1-dcache-prefetches                               [Hardware cache event]
  L1-dcache-prefetch-misses                          [Hardware cache event]
  L1-icache-loads                                    [Hardware cache event]
  L1-icache-load-misses                              [Hardware cache event]
  L1-icache-prefetches                               [Hardware cache event]
  L1-icache-prefetch-misses                          [Hardware cache event]
  LLC-loads                                          [Hardware cache event]
  LLC-load-misses                                    [Hardware cache event]
  LLC-stores                                         [Hardware cache event]
  LLC-store-misses                                   [Hardware cache event]
  LLC-prefetches                                     [Hardware cache event]
  LLC-prefetch-misses                                [Hardware cache event]
  dTLB-loads                                         [Hardware cache event]
  dTLB-load-misses                                   [Hardware cache event]
  dTLB-stores                                        [Hardware cache event]
  dTLB-store-misses                                  [Hardware cache event]
  dTLB-prefetches                                    [Hardware cache event]
  dTLB-prefetch-misses                               [Hardware cache event]
  iTLB-loads                                         [Hardware cache event]
  iTLB-load-misses                                   [Hardware cache event]
  branch-loads                                       [Hardware cache event]
  branch-load-misses                                 [Hardware cache event]

#perf list tracepoint
  xfs:xfs_attr_list_sf                               [Tracepoint event]
  xfs:xfs_attr_list_sf_all                           [Tracepoint event]
  xfs:xfs_attr_list_leaf                             [Tracepoint event]
  xfs:xfs_attr_list_leaf_end                         [Tracepoint event]
  xfs:xfs_attr_list_full                             [Tracepoint event]
  xfs:xfs_attr_list_add                              [Tracepoint event]
  xfs:xfs_attr_list_wrong_blk                        [Tracepoint event]
  xfs:xfs_attr_list_notfound                         [Tracepoint event]
  xfs:xfs_attr_leaf_list                             [Tracepoint event]
  xfs:xfs_attr_node_list                             [Tracepoint event]
......
perf可以用的命令
#perf

 usage: perf [--version] [--help] COMMAND [ARGS]

 The most commonly used perf commands are:
   annotate        Read perf.data (created by perf record) and display annotated code
   archive         Create archive with object files with build-ids found in perf.data file
   bench           General framework for benchmark suites
   buildid-cache   Manage build-id cache.
   buildid-list    List the buildids in a perf.data file
   diff            Read two perf.data files and display the differential profile
   evlist          List the event names in a perf.data file
   inject          Filter to augment the events stream with additional information
   kmem            Tool to trace/measure kernel memory(slab) properties
   kvm             Tool to trace/measure kvm guest os
   list            List all symbolic event types
   lock            Analyze lock events
   record          Run a command and record its profile into perf.data
   report          Read perf.data (created by perf record) and display the profile
   sched           Tool to trace/measure scheduler properties (latencies)
   script          Read perf.data (created by perf record) and display trace output
   stat            Run a command and gather performance counter statistics
   test            Runs sanity tests.
   timechart       Tool to visualize total system behavior during a workload
   top             System profiling tool.
每个命令的帮助
man perf-CMD 例如 man perf-top
使用最多的是perf top。类似oprofile获得的统计信息,但是oprofile可以跟踪到代码中,perf top是指令统计。
例如
以下是在创建一个GIST索引时的perf top输出。
   PerfTop:    1320 irqs/sec  kernel:23.3%  exact:  0.0% [1000Hz cycles],  (all, 32 CPUs)
-------------------------------------------------------

samples  pcnt functionDSO
_______ _____ _________________________________ ________________________________________________

3528.00 31.2% gistchoose           /u02/digoal/soft_bak/pgsql9.5/bin/postgres
2612.00 23.1% gist_box_penalty     /u02/digoal/soft_bak/pgsql9.5/bin/postgres
 543.00  4.8% FunctionCall3Coll    /u02/digoal/soft_bak/pgsql9.5/bin/postgres
 441.00  3.9% aliflash_reconfig_task            [aliflash]
 438.00  3.9% FunctionCall1Coll    /u02/digoal/soft_bak/pgsql9.5/bin/postgres
 378.00  3.3% hash_search_with_hash_value       /u02/digoal/soft_bak/pgsql9.5/bin/postgres
 234.00  2.1% isnanf  /lib64/libc-2.12.so
 169.00  1.5% LWLockAcquire        /u02/digoal/soft_bak/pgsql9.5/bin/postgres
 152.00  1.3% gistDeCompressAtt    /u02/digoal/soft_bak/pgsql9.5/bin/postgres
 142.00  1.3% LWLockRelease        /u02/digoal/soft_bak/pgsql9.5/bin/postgres
 135.00  1.2% copy_user_enhanced_fast_string    [kernel.kallsyms]
 115.00  1.0% gistProcessItup      /u02/digoal/soft_bak/pgsql9.5/bin/postgres
 106.00  0.9% _raw_spin_lock       [kernel.kallsyms]
 100.00  0.9% gist_box_decompress  /u02/digoal/soft_bak/pgsql9.5/bin/postgres
  78.00  0.7% AllocSetAlloc        /u02/digoal/soft_bak/pgsql9.5/bin/postgres
  69.00  0.6% _raw_spin_lock_irq   [kernel.kallsyms]
  66.00  0.6% PinBuffer            /u02/digoal/soft_bak/pgsql9.5/bin/postgres
  63.00  0.6% hash_any/u02/digoal/soft_bak/pgsql9.5/bin/postgres
  58.00  0.5% gistgetadjusted      /u02/digoal/soft_bak/pgsql9.5/bin/postgres
  56.00  0.5% __schedule           [kernel.kallsyms]
  46.00  0.4% gist_box_union       /u02/digoal/soft_bak/pgsql9.5/bin/postgres
  45.00  0.4% __list_del_entry     [kernel.kallsyms]
  44.00  0.4% heap_getnext         /u02/digoal/soft_bak/pgsql9.5/bin/postgres
  42.00  0.4% find_get_pages       [kernel.kallsyms]
  42.00  0.4% ReadBuffer_common    /u02/digoal/soft_bak/pgsql9.5/bin/postgres
  41.00  0.4% UnpinBuffer          /u02/digoal/soft_bak/pgsql9.5/bin/postgres
  40.00  0.4% update_lunset_sq_head[aliflash]
  37.00  0.3% huge_pte_offset      [kernel.kallsyms]
  37.00  0.3% memcpy  /lib64/libc-2.12.so
  33.00  0.3% dm_blk_close         /lib/modules/3.18.24/kernel/drivers/md/dm-mod.ko
  32.00  0.3% __memcmp_sse4_1      /lib64/libc-2.12.so
  30.00  0.3% gistPushItupToNodeBuffer          /u02/digoal/soft_bak/pgsql9.5/bin/postgres
  30.00  0.3% _raw_spin_lock_irqsave            [kernel.kallsyms]
  28.00  0.2% pg_qsort/u02/digoal/soft_bak/pgsql9.5/bin/postgres
  28.00  0.2% _raw_spin_lock_bh    [kernel.kallsyms]
  26.00  0.2% slot_deform_tuple    /u02/digoal/soft_bak/pgsql9.5/bin/postgres
  26.00  0.2% xfs_alloc_ioend      /lib/modules/3.18.24/kernel/fs/xfs/xfs.ko
  25.00  0.2% hash_uint32          /u02/digoal/soft_bak/pgsql9.5/bin/postgres
  25.00  0.2% xfs_fs_geometry      /lib/modules/3.18.24/kernel/fs/xfs/xfs.ko
  22.00  0.2% palloc  /u02/digoal/soft_bak/pgsql9.5/bin/postgres
  22.00  0.2% __block_commit_write [kernel.kallsyms]
  22.00  0.2% __switch_to          [kernel.kallsyms]
  22.00  0.2% __random_r           /lib64/libc-2.12.so
  21.00  0.2% LockBuffer           /u02/digoal/soft_bak/pgsql9.5/bin/postgres
  21.00  0.2% apic_timer_interrupt [kernel.kallsyms]
  21.00  0.2% lapic_next_deadline  [kernel.kallsyms]
  20.00  0.2% gist_box_same        /u02/digoal/soft_bak/pgsql9.5/bin/postgres
其他诊断工具:
oprofile
http://blog.163.com/digoal@126/blog/static/163877040201549115140794/
systemtap
blktrace
iowatcher
iotop