
Prometheus 对比 Zabbix
和 Zabbix 类似,Prometheus 也是一个近年比较火的开源监控框架,和 Zabbix不同之处在于 Prometheus 相对更灵活点,模块间比较解耦,比如告警模块、代理模块等等都可以选择性配置。服务端和客户端都是开箱即用,不需要进行安装。Zabbix则是一套安装把所有东西都弄好,很庞大也很繁杂。
Zabbix 的客户端 agent 可以比较方便的通过脚本来读取机器内数据库、日志等文件来做上报。而 Prometheus 的上报客户端则分为不同语言的SDK和不同用途的 exporter 两种,比如如果你要监控机器状态、mysql性能等,有大量已经成熟的 exporter 来直接开箱使用,通过http通信来对服务端提供信息上报(server去pull信息);
而如果你想要监控自己的业务状态,那么针对各种语言都有官方或其他人写好的 sdk 供你使用,都比较方便,不需要先把数据存入数据库或日志再供 zabbix-agent 采集。
Zabbix 的客户端更多是只做上报的事情,push 模式。而 Prometheus 则是客户端本地也会存储监控数据,服务端定时来拉取想要的数据。
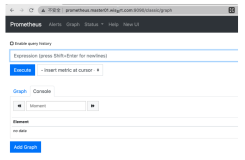
界面来说 zabbix 比较陈旧,而 prometheus 比较新且非常简洁,简洁到只能算一个测试和配置平台。要想获得良好的监控体验,搭配 Grafana 还是二者的必走之路。
安装 Prometheus
Prometheus 有很多种安装方式,可以在官网看到,这里只介绍下载安装包解压的方式,因为 Prometheus 是“开箱即用”的,也就是说解压安装包后就可以直接使用了,不需要再执行安装程序,很方便。
可以去 Prometheus 的官网下载页面获取最新版本的信息,比如现在的最新版本是2.7.2,那就下载相应系统的安装包,然后解压
$ wget https://github.com/prometheus/prometheus/releases/download/v2.7.2/prometheus-2.7.2.linux-amd64.tar.gz
$ tar xvfz prometheus-2.7.2.linux-amd64.tar.gz
解压后当前目录就会出现一个相应的文件夹,进入该文件夹,然后就可以直接运行Prometheus server了!
$ cd prometheus-2.7.2.linux-amd64
// 查看版本
$ ./prometheus --version
// 运行server
$ ./prometheus --config.file=prometheus.yml
命令中的 prometheus.yml 文件其实就是配置文件,也在当前目录下,在其中可以配置一些东西。
配置 Prometheus
上文说了,prometheus.yml 是配置文件,打开可以看到不多的几十行文字,类似下面:
$ cat prometheus.yml
.# my global config
global:
scrape_interval: 15s # Set the scrape interval to every 15 seconds. Default is every 1 minute.
evaluation_interval: 15s # Evaluate rules every 15 seconds. The default is every 1 minute.
.# scrape_timeout is set to the global default (10s).
.# Alertmanager configuration
alerting:
alertmanagers:
-
static_configs:
- targets:
.# - alertmanager:9093
- targets:
.# Load rules once and periodically evaluate them according to the global 'evaluation_interval'.
rule_files:
.# - "first_rules.yml"
.# - "second_rules.yml"
.# A scrape configuration containing exactly one endpoint to scrape:
.# Here it's Prometheus itself.
scrape_configs:
.# The job name is added as a label job=<job_name> to any timeseries scraped from this config.
- job_name: 'prometheus'
.# metrics_path defaults to '/metrics'
.# scheme defaults to 'http'.
static_configs:
- targets: ['localhost:9090']
其大致分为四部分:
global:全局配置,其中 scrape_interval 表示抓取一次数据的间隔时间,evaluation_interval 表示进行告警规则检测的间隔时间;
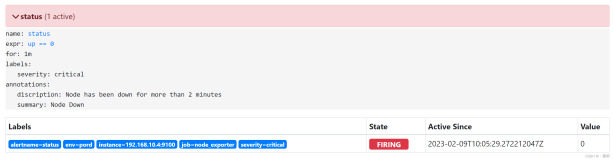
alerting:告警管理器(Alertmanager)的配置,目前还没有安装Alertmanager;
rule_files:告警规则有哪些;
scrape_configs:抓取监控信息的目标。一个 job_name 就是一个目标,其 targets 就是采集信息的 IP 和端口。这里默认监控了 Prometheus 自己,可以通过修改这里来修改 Prometheus 的监控端口。
Prometheus 的每个 exporter 都会是一个目标,它们可以上报不同的监控信息,比如机器状态,或者 mysql 性能等等,不同语言 sdk 也会是一个目标,它们会上报你自定义的业务监控信息。