前言
- blktrace的作者正是block io的maintainer,开发此工具,可以更好的追踪IO的过程。
- blktrace 结合btt可以统计一个IO是在调度队列停留的时间长,还是在硬件上消耗的时间长,利用这个工具可以协助分析和优化问题。
blktrace的原理
一个I/O请求的处理过程,可以梳理为这样一张简单的图:
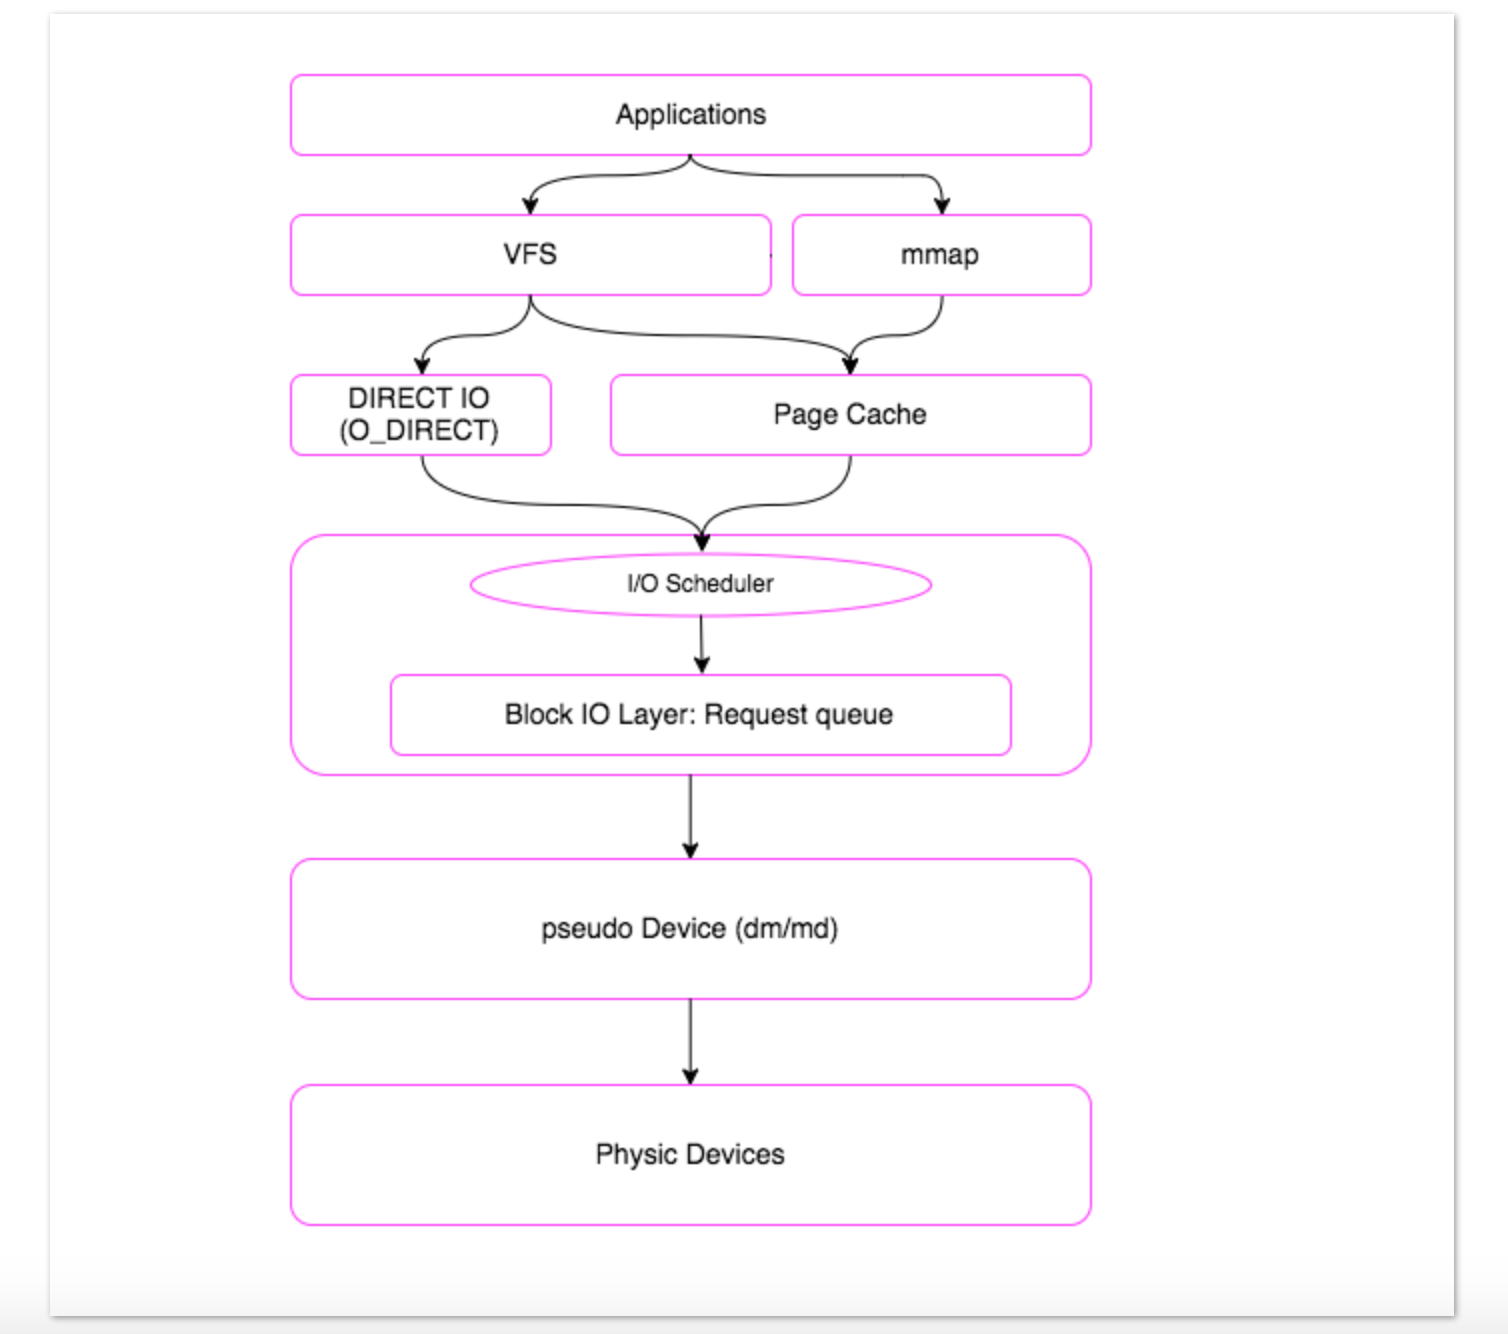
一个I/O请求进入block layer之后,可能会经历下面的过程:
-
I/O enters block layer – it can be:
- Remapped onto another device (MD, DM)
- Split into 2 separate I/Os (alignment, size, ...)
- Added to the request queue
- Merged with a previous entry on the queue All I/Os end up on a request queue at some point
- At some later time, the I/O is issued to a device driver, and submitted to a device
- Later, the I/O is completed by the device, and its driver
blkparse显示的各指标点示意:
 Q------->G------------>I--------->M------------------->D----------------------------->C
 |-Q time-|-Insert time-|
 |--------- merge time ------------|-merge with other IO|
 |----------------scheduler time time-------------------|---driver,adapter,storagetime--|

 |----------------------- await time in iostat output ----------------------------------|
其中:
- Q2Q — time between requests sent to the block layer
- Q2G — time from a block I/O is queued to the time it gets a request allocated for it
- G2I — time from a request is allocated to the time it is Inserted into the device's queue
- Q2M — time from a block I/O is queued to the time it gets merged with an existing request
- I2D — time from a request is inserted into the device's queue to the time it is actually issued to the device
- M2D — time from a block I/O is merged with an exiting request until the request is issued to the device
- D2C — service time of the request by the device
- Q2C — total time spent in the block layer for a request
blktrace 能够记录下IO所经历的各个步骤:
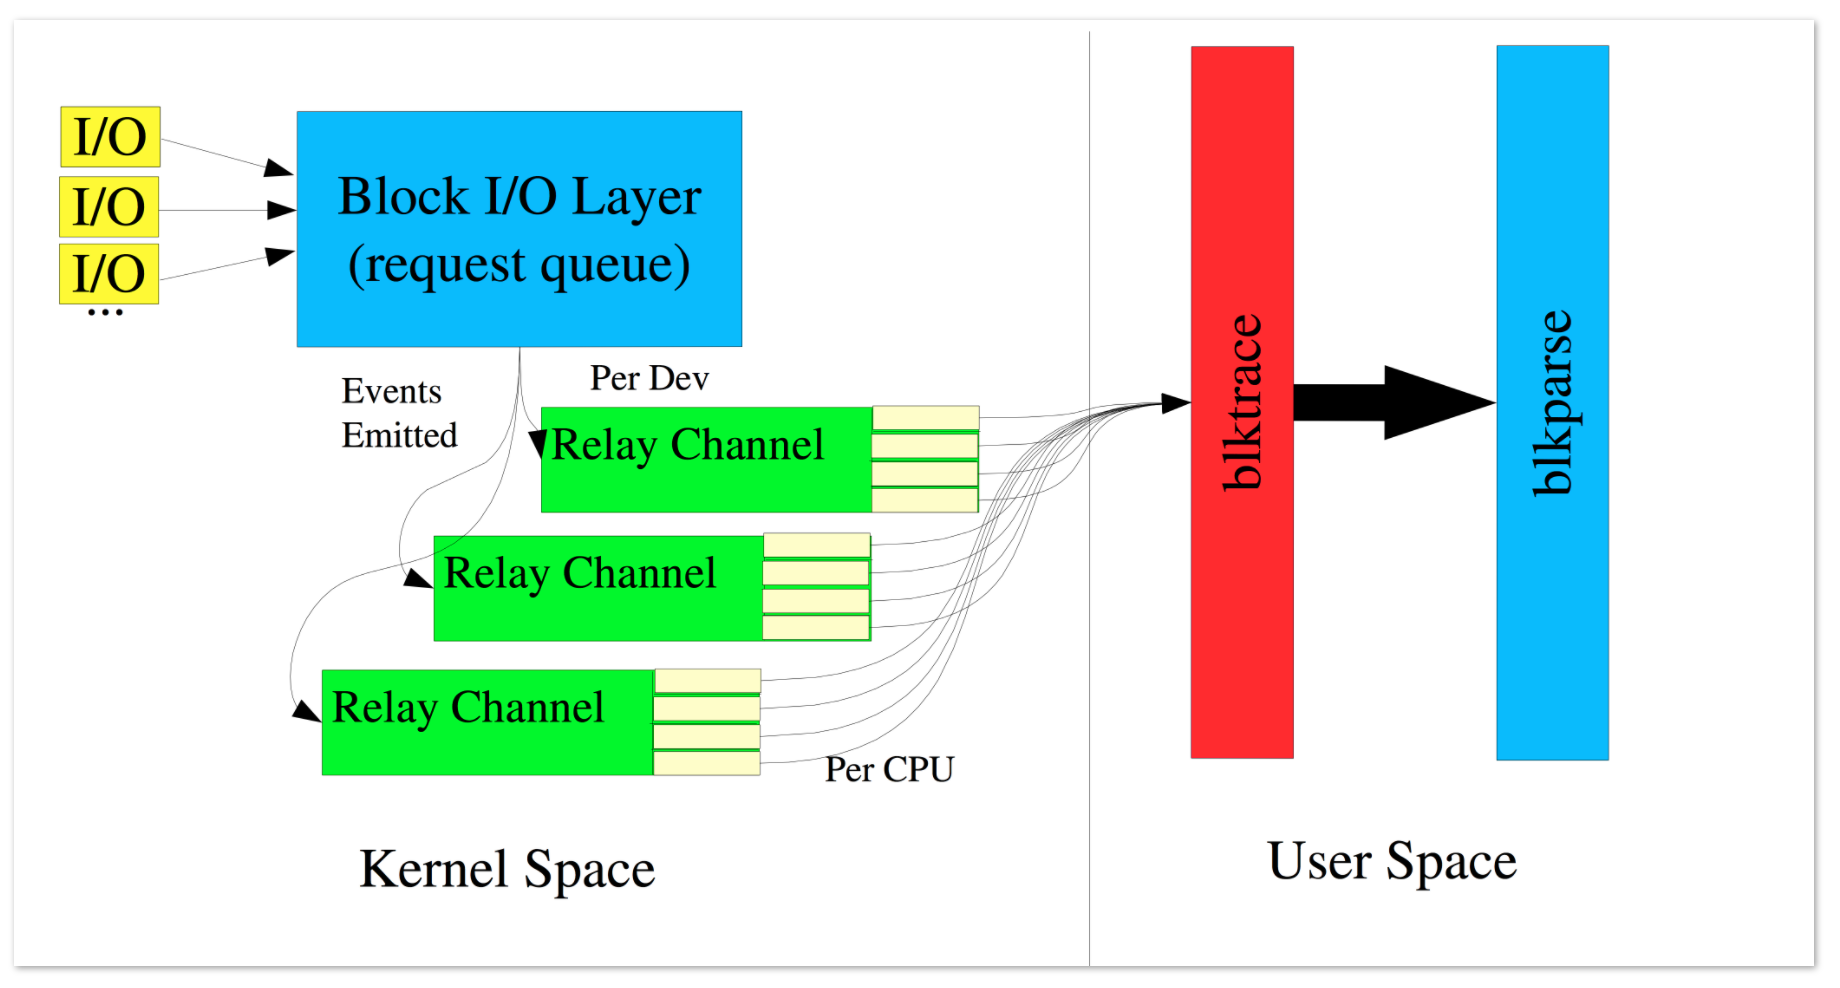
blktrace的输出:
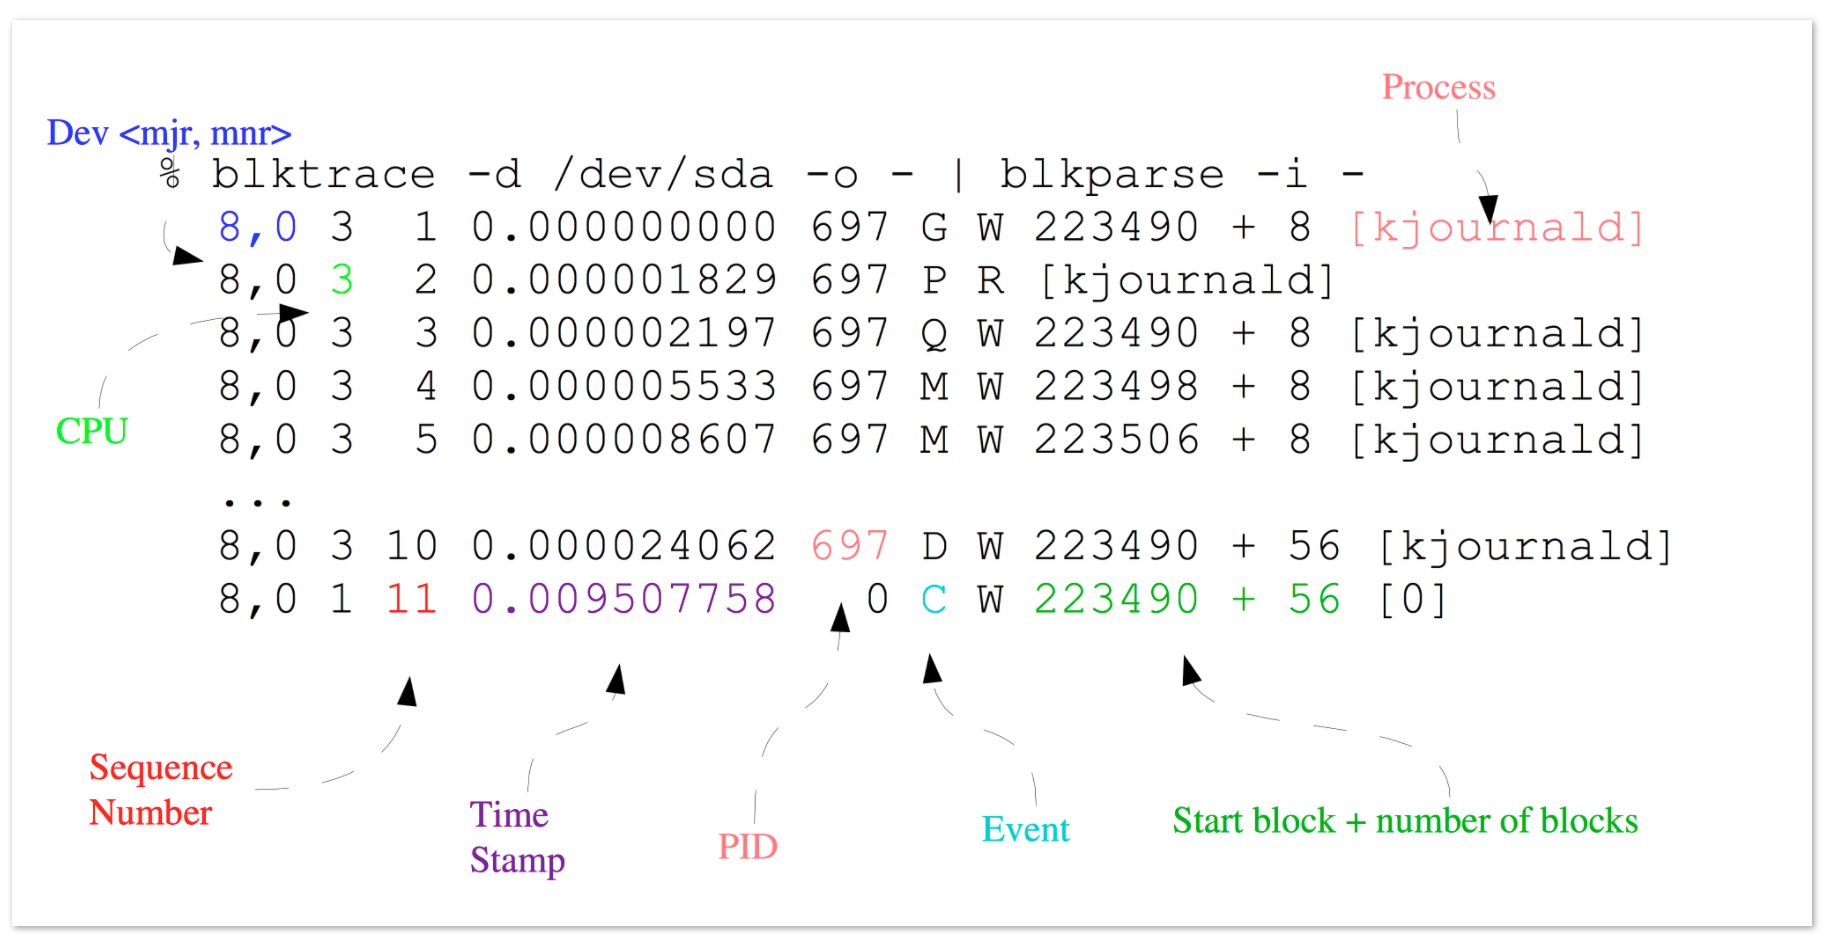
- 第一个字段:8,0 这个字段是设备号 major device ID和minor device ID。
- 第二个字段:3 表示CPU
- 第三个字段:11 序列号
- 第四个字段:0.009507758 Time Stamp是时间偏移
- 第五个字段:PID 本次IO对应的进程ID
- 第六个字段:Event,这个字段非常重要,反映了IO进行到了那一步
- 第七个字段:R表示 Read, W是Write,D表示block,B表示Barrier Operation
- 第八个字段:223490+56,表示的是起始block number 和 number of blocks,即我们常说的Offset 和 Size
- 第九个字段: 进程名
其中第六个字段非常有用:每一个字母都代表了IO请求所经历的某个阶段。
Q – 即将生成IO请求
|
G – IO请求生成
|
I – IO请求进入IO Scheduler队列
|
D – IO请求进入driver
|
C – IO请求执行完毕
blktrace的用法
实际上blktrace仅仅是用来采集数据,数据的分析其实有很多辅助的工具,比如:
- blkparse
- btt
- blkiomon
- iowatcher
这些工具都是利用blktrace采集的数据,更好的分析,然后输出。
使用blktrace前提需要挂载debugfs。
mount –t debugfs debugfs /sys/kernel/debug实时查看:
blktrace只负责采集,blkparse 负责解析成适合人类看的文字:
blktrace -o 指定输出
#blktrace -d /dev/sda -o - | blkparse -i -
先采集,再查看:
1. 先采集,将会在当前目录获得一堆的文件,缺省的输出文件名是 sdb.blktrace.<cpu>,每个CPU对应一个文件。
#blktrace /dev/sda /dev/sdb
2. 给blkparse传递磁盘的名字,将会直接解析。
#blkparse sda sdb
blktrace产生的文件太零散怎么办?
生成采集文件
#blktrace -d /dev/sda合并成一个二进制文件
#blkparse -i sda -d sda.blktrace.bin其实我们还是嫌弃blkparse的输出太多,不方便查看,此时可以利用btt协助分析统计
#btt -i sda.blktrace.bin -l sda.d2c_latency

# 这里就可以看到,每个阶段,消耗的时间
[root@localhost2 /data/sandbox/blktrace_test]
#btt -i sda.blktrace.bin -l sda.d2c_latency
==================== All Devices ====================

            ALL           MIN           AVG           MAX           N
--------------- ------------- ------------- ------------- -----------

Q2Q               0.000000238   0.126069031   5.007614945          40
Q2G               0.000000556   0.000001765   0.000006022          11
G2I               0.000000528   0.000003506   0.000015113          11
Q2M               0.000000135   0.000000209   0.000001162          30
I2D               0.000000396   0.000001240   0.000003602          11
M2D               0.000002235   0.000007047   0.000014071          30
D2C               0.003104665   0.015828304   0.028136240          41
Q2C               0.003117684   0.015835360   0.028138401          41

# 这里看到整个IO下来,每个阶段所消耗的时间,占用百分比
==================== Device Overhead ====================

       DEV |       Q2G       G2I       Q2M       I2D       D2C
---------- | --------- --------- --------- --------- ---------
 (  8,  0) |   0.0030%   0.0059%   0.0010%   0.0021%  99.9554%
---------- | --------- --------- --------- --------- ---------
   Overall |   0.0030%   0.0059%   0.0010%   0.0021%  99.9554%

==================== Device Merge Information ====================

       DEV |       #Q       #D   Ratio |   BLKmin   BLKavg   BLKmax    Total
---------- | -------- -------- ------- | -------- -------- -------- --------
 (  8,  0) |       41       11     3.7 |        8       29      144      328
- Q2I – time it takes to process an I/O prior to it being inserted or merged onto a request queue – Includes split, and remap time
- I2D – time the I/O is “idle” on the request queue
- D2C – time the I/O is “active” in the driver and on the device
- Q2I + I2D + D2C = Q2C
- Q2C: Total processing time of the I/O
注意:
D2C: 表征块设备性能的关键指标
Q2C: 客户发起请求到收到响应的时间
D2C 平均时间:0.015828304 秒,即15.82毫秒
Q2C 平均时间:0.015835360 秒,即15.83毫秒
平均下来,D2C 阶段消耗时间占比 99.9554%
上述命令其实还会产生一些.dat文件,可以看到iops信息
#ll *.dat
-rw-r--r-- 1 root root    6 Nov 21 14:51 8,0_iops_fp.dat
-rw-r--r-- 1 root root   11 Nov 21 14:51 8,0_mbps_fp.dat
-rw-r--r-- 1 root root 3006 Nov 21 14:51 sda.d2c_latency_8,0_d2c.dat
-rw-r--r-- 1 root root    6 Nov 21 14:51 sys_iops_fp.dat
-rw-r--r-- 1 root root   11 Nov 21 14:51 sys_mbps_fp.dat
5. btt -q
#btt -i sda.blktrace.bin -q sda.q2c_latency
文件解释:
sys_mbps_fs.dat: 本次统计中所有设备吞吐量
sys_iops_fp.dat: 中是本次统计中所有设备的IOPS
每个请求的d2c的latency详情:
sda.d2c_latency_8,0_d2c.dat修改blkparse的输出格式:
[root@localhost2 /data/sandbox]
#blktrace -d /dev/sda -o - | blkparse -i - -f "%D %2c %8s %5T.%9t %5p %2a %3d\n"
  8,0    9        1     0.000000000  8863  A   W
一次IO的生命周期:direct read 附录见测试代码
[root@localhost /home/ahao.mah/sdc]
#blktrace -d /dev/sdc  -o - | blkparse -i -

  8,32   7        1     0.000000000  2923  Q   R 272208 + 2 [direct_io_read_]
  8,32   7        2     0.000002526  2923  G   R 272208 + 2 [direct_io_read_]
  8,32   7        3     0.000003142  2923  P   N [direct_io_read_]
  8,32   7        4     0.000004575  2923  I   R 272208 + 2 [direct_io_read_]
  8,32   7        5     0.000005402  2923  U   N [direct_io_read_] 1
  8,32   7        6     0.000006775  2923  D   R 272208 + 2 [direct_io_read_]
  8,32   7        7     0.000200150 32031  C   R 272208 + 2 [0]

以上就是一次IO请求的生命周期,从actions看到,分别是QGPIUDC
Q:先产生一个该位置的IO意向插入到io队列,此时并没有真正的请求
G:发送一个实际的Io请求给设备
P(plugging):插入:即等待即将到来的更多的io请求进入队列,以便系统能进行IO优化,减少执行IO请求时花的时间
I:将IO请求进行调度,到这一步请求已经完全成型(formed)好了
U (unplugging):拔出,设备决定不再等待其他的IO请求并使得系统必须响应当前IO请求,将该IO请求传给设备驱动器。可以看到,在P和U之间会等待IO,然后进行调度。这里会对IO进行一点优化,
 但是程度很低,因为等待的时间很短,是纳秒级别的
D :发布刚才送入驱动器的IO请求
C:结束IO请求,这里会返回一个执行状态:失败或者成功,在进程号处为0表示执行成功,反之则反
到此一个IO的周期就结束了
一次IO的生命周期:direct write 附录见测试代码
[root@localhost /home/ahao.mah/sdc]
#taskset -c 1 ./direct_io_write_file_one &
[1] 57376
write success
[1]+  Done                    taskset -c 1 ./direct_io_write_file_one
[root@localhost /home/ahao.mah/blktrace/jiangyi]
#time /usr/bin/blktrace -w 100 -d /dev/sdc -o - | /usr/bin/blkparse -w 100 -i -
8,32 1 1 0.000000000 57376 Q WS 272208 + 2 [direct_io_write]
8,32 1 2 0.000005514 57376 G WS 272208 + 2 [direct_io_write]
8,32 1 3 0.000006880 57376 P N [direct_io_write]
8,32 1 4 0.000009793 57376 I WS 272208 + 2 [direct_io_write]
8,32 1 5 0.000011264 57376 U N [direct_io_write] 1
8,32 1 6 0.000013478 57376 D WS 272208 + 2 [direct_io_write]
8,32 0 1 0.000281069 0 C WS 272208 + 2 [0]
blktrace -a 参数可以指定监控的动作:
1.     blktrace /dev/block/mmcblk0p1 -o /data/trace  命令解析:监控mmcblk0p1块设备,将生成的文件存储在/data目录下,一共生成4个文件,文件以trace开头,分别为trace.blktrace.0  trace.blktrace.1 trace.blktrace.2trace.blktrace.3分别对应cpu0、cpu1、cpu2、cpu3
2.     blktrace /dev/block/mmcblk0p1 -D /data/trace  命令解析:监控mmcblk0p1块设备,在/data目录下建立一个名字为trace的文件夹,trace文件夹下存放的是名字为                                                                   mmcblk0p1.blktrace.0mmcblk0p1.blktrace.1 mmcblk0p1.blktrace.2 mmcblk0p1.blktrace.3                                                                   分别对应cpu0 cpu1 cpu2 cpu3
3.     blktrace /dev/block/mmcblk0p1 -o /data/trace -w 10  命令解析:-w 选项表示多长时间之后停止监控(单位:秒)  -w 10 表示10秒之后停止监控
4.     blktrace /dev/block/mmcblk0p1 -o /data/trace -a WRITE   命令解析:-a 代表只监控写操作
选项 -a action 表示要监控的动作,action的动作有:
READ (读)
WRITE(写)
BARRIER
SYNC
QUEUE
REQUEUE
ISSUE
COMPLETE
FS
PC
其他工具:blkiomon
对设备/dev/sda的io监控120秒,每2秒显示一次
# blktrace /dev/sda -a issue -a complete -w 120 -o - | blkiomon -I 2 -h -[root@localhost2 /data/sandbox/blktrace_test]
# blktrace /dev/sda -a issue -a complete -w 120 -o - | blkiomon -I 2 -h -
time: Tue Nov 21 14:04:48 2017
device: 8,0
sizes read (bytes): num 0, min -1, max 0, sum 0, squ 0, avg 0.0, var 0.0
sizes write (bytes): num 2, min 4096, max 49152, sum 53248, squ 2432696320, avg 26624.0, var 507510784.0
d2c read (usec): num 0, min -1, max 0, sum 0, squ 0, avg 0.0, var 0.0
d2c write (usec): num 2, min 8322, max 10708, sum 19030, squ 183916948, avg 9515.0, var 1423249.0
throughput read (bytes/msec): num 0, min -1, max 0, sum 0, squ 0, avg 0.0, var 0.0
throughput write (bytes/msec): num 2, min 492, max 4590, sum 5082, squ 21310164, avg 2541.0, var 4198401.0
sizes histogram (bytes):
0: 0 1024: 0 2048: 0 4096: 1
8192: 0 16384: 0 32768: 0 65536: 1
131072: 0 262144: 0 524288: 0 1048576: 0
2097152: 0 4194304: 0 8388608: 0 > 8388608: 0
d2c histogram (usec):
0: 0 8: 0 16: 0 32: 0
64: 0 128: 0 256: 0 512: 0
1024: 0 2048: 0 4096: 0 8192: 0
16384: 2 32768: 0 65536: 0 131072: 0
262144: 0 524288: 0 1048576: 0 2097152: 0
4194304: 0 8388608: 0 16777216: 0 33554432: 0
>33554432: 0
bidirectional requests: 0
Ref
http://www.cse.unsw.edu.au/~aaronc/iosched/doc/blktrace.html
http://blog.csdn.net/u012317833/article/details/23275005
blktrace git
git clone git://git.kernel.dk/blktrace.git测试代码
#cat direct_io_read_file_one.c
#include <stdio.h>
#include <stdlib.h>
#include <unistd.h>
#include <sys/file.h>
#include <sys/types.h>
#include <sys/stat.h>
#include <string.h>
#define BUF_SIZE 1024

int main()
{
    int fd;
    int ret;
    unsigned char *buf;
    ret = posix_memalign((void **)&buf, 512, BUF_SIZE);
    if (ret) {
        perror("posix_memalign failed");
        exit(1);
    }

    fd = open("./direct_io.data", O_RDONLY | O_DIRECT, 0755);
    if (fd < 0){
        perror("open ./direct_io.data failed");
        exit(1);
    }

    ret = read(fd, buf, BUF_SIZE);
    if (ret < 0) {
        perror("write ./direct_io.data failed");
    }

    free(buf);
    close(fd);
}
[root@localhost /home/ahao.mah/sdc]
#cat direct_io_write_file_one.c
#define _GNU_SOURCE
#include <stdio.h>
#include <stdlib.h>
#include <unistd.h>
#include <sys/file.h>
#include <sys/types.h>
#include <sys/stat.h>
#include <string.h>
#define BUF_SIZE 1024
int main(int argc, char * argv[])
{
int fd;
int ret;
unsigned char *buf;
ret = posix_memalign((void **)&buf, 512, BUF_SIZE);
if (ret) {
perror("posix_memalign failed");
exit(1);
}
memset(buf, 'c', BUF_SIZE);
fd = open("./direct_io.data", O_WRONLY | O_CREAT | O_DIRECT, 0755);
if (fd < 0){
perror("open ./direct_io.data failed");
free(buf);
exit(1);
}
ret = write(fd, buf, BUF_SIZE);
if (ret < 0) {
perror("write ./direct_io.data failed");
} else {
printf("write success\n");
}
free(buf);
close(fd);
}