In our previous blog post, we talked about troubleshooting high CPU usage on Alibaba Cloud ApsaraDB for RDS SQL Server.
SQL Server is an open-source relational database management system (RDBMS). Its primary function is to store and retrieve data when required by other applications. Because SQL Server is sensitive to latency, higher CPU latency might result in performance issues. Therefore, it is essential to bring down the CPU usage to the extent possible by looking into the component that is causing this challenge. This article highlights seven possible causes of high CPU usage and their probable remedies.
In this article, we will look at some frequently asked questions about SQL Server delays and their answers.
1. How can we use XML check in DMV to check for conversion?
Open the actual execution plan > execute the query > open the execution plan XML, and you will find implicit data type conversion in the two places shown in the figure below.
First,

Second,

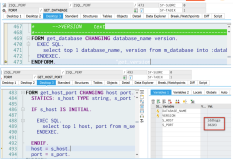
The steps to view the execution plan are as follows:
Step 1: Open the actual execution plan.

Step 2: Execute the query statement.
Step 3: Open the execution plan XML: Right click the execution plan to select: Show Execution Plan XML.

Step 4: Search for the keyword "Convert" in the opened XML.
The above illustrates the manual viewing method. You can write an XML parsing method to get XML in the execution plan cache and search for the keyword
2. The execution of stored procedures takes as long as 100 minutes, but CPU usage is not high. How can we solve this problem?
This is not a high CPU usage problem, but an overlong execution issue. It also deserves extreme care and attention. I encountered a similar case before in which the developer wrote a dead loop inside the stored procedure, resulting in a very long execution time and a failure to exit. The solutions include:
Method 1: Use Profiler Trace. These events should do it.

Here remember to set Filter:

Method 2: Execute the following queries constantly to check which statement slows down the stored procedure execution and tune the specific statement.
select
        @@servername AS Server
        ,B.Text
        ,sql_statement = (SELECT TOP 1 SUBSTRING(B.Text,stmt_start / 2+1 ,
                         (
                            (
                            CASE WHEN stmt_end = -1 THEN (LEN(CONVERT(nvarchar(max),B.text)) * 2)
                                   ELSE stmt_end END
                            )  - stmt_start) / 2+1
                         )
                      )
        ,A.hostName
        ,A.program_name
        ,A.loginame
        ,db_name(a.dbid) AS DbName
        ,A.status
        ,A.lastwaittype
        ,A.waitresource
        ,A.spid
        ,A.blocked
        ,A.login_time
        ,currnet_time = GETDATE()
        ,duration = DATEDIFF(MINUTE,login_time,GETDATE())
        --,A.*,B.*
from sys.sysprocesses AS A
cross apply sys.dm_exec_sql_text(A.sql_handle) aS B
where B.text like '%YourStoreProcedureName%'
AND A.spid <>  @@SPID
3. Currently, our largest table with GUID as the primary key contains 40 million data records. Will there be any performance problems after the number of data records exceeds 100 million? Is there any solution?
We would not recommend using GUID as the primary key very often for the following reasons:
First, the GUID field is too wide, specifically char (36), resulting in a high primary key band. It will indirectly lead to increased space for other non-primary key indexes (since non-primary key indexes need to record the value of the primary key). The larger the data space, the higher I/O used for queries, and the greater the CPU usage and the lower the efficiency.
Second, the size of each GUID value is unpredictable. When you insert new data into the table, if the GUID primary key is clustered, the data may be inserted between two rows of data. For example, the primary keys of the previous two rows of data are a and c, when b data comes in, it will insert data between a and c. This may lead to data movement.
Third, using GUID value as the primary key leads to primary key index fragmentation. You can follow the methods described above to understand index fragmentation.
Suggested Practice:
We suggest you use the "identity" attribute column to replace the GUID column as the primary key. The values in the identity attribute column are predictable. Also, the next primary key value must be greater than the previous one. Hence, SQL Server can write data rows one after another, without worrying about the insertion of data in the middle. The benefits are, first, the int data type substantially reduces the width, thereby reducing the I/O overhead and CPU overhead. Secondly, there is no data movement overhead. Lastly, it can also significantly reduce the probability of index fragmentation.
4. Will a statistics update affect the query?
Yes, it will, in two aspects - one positive and one negative.
First, it may result in the blockage of queries for a short time during the process of updating. However, you can solve this by choosing to perform the update during off-peak hours.
Second, after the update, the execution plan evaluation may be more accurate, resulting in the query being more efficient.
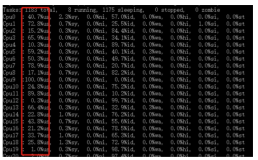
5. The CPU usage is too high, but all other indicators are low. What is the problem?
It may be because of a CPU bottleneck. Here are some troubleshooting ideas: if you have optimized the database, but CPU usage remains too high, and other indicators remain low, you can infer that the CPU has met its bottleneck.
6. The execution efficiency of the same statement varies greatly in different time periods. Is it because of database performance decline?
If the query statement is the same and the data result is the same, first, it may be because there is database blocking or other high-I/O or high-CPU-consuming query statements are impacting your queries; second, it may be the case discussed in the parameter sniffing section.
If the query is the same, but the data result sets are different, we may first advise you to consider that the database may be askew. It is normal for queries with different condition values and data sizes to deliver different performance levels. If the read data size is large, the query efficiency is low; otherwise, the efficiency is high.
7. Why does the database still generate a wrong execution plan after statistics are updated, and clearing the plan guide doesn't help, either?
You need to clear the execution plan cache. Updating statistics needs to cover all tables involved in the corresponding query (or view in some cases, where you need to find corresponding tables in the view). Another idea is that you may need to tune the index design. Also, look into it if there are any missing indexes, duplicate indexes or fragmented indexes.
8. Is profiler's automatic optimization recommendation reliable?
No, it is unreliable, but can serve as a reference. You need to assess it.
9. When is it a good time to re-build indexes for a large table?
The approach can be to split large tables into smaller ones, such as partitioning them. Then re-build indexes for each partition one by one. The re-building time must correspond to off-peak hours. Make sure you set the ONLINE = ON option for enterprise edition to further reduce the impact on your business. Timing suggestions: <10%: do nothing; 10% - 30%: reorganize; > 30%: rebuild.